...
Each cluster contains a locator and two servers, but "Cluster-1" has gw senders and "Cluster-2" has gw receivers.
$ kubectl --namespace=geode-cluster-2 get all
NAME READY STATUS RESTARTS AGE
pod/locator-0 1/1 Running 0 55m
pod/server-0 1/1 Running 0 55m
pod/server-1 1/1 Running 0 55m
NAME TYPE CLUSTER-IP EXTERNAL-IP PORT(S) AGE
service/locator-site2-service ClusterIP None <none> 10334/TCP 55m
service/receiver-site2-service NodePort 10.103.196.204 <none> 32000:32000/TCP 55m
service/server-site2-service ClusterIP None <none> 30303/TCP 55m
NAME READY AGE
statefulset.apps/locator 1/1 55m
statefulset.apps/server 2/2 55m
|
Problem 1: Gw sender failover
...
When same host and port is used for all gw receivers, pings are not handled correctly. We have observed different behaviors:
Test 1:
Cluster-2 gfsh>list gateways
GatewayReceiver Section
Member | Port | Sender Count | Senders Connected
--------------------------------- | ----- | ------------ | ------------------------------------------------------------------------------------------------------------
172.17.0.5(server-0:65)<v1>:41000 | 32000 | 6 | 172.17.0.4(server-0:65)<v1>:41000, 172.17.0.8(server-1:47)<v1>:41000, 172.17.0.8(server-1:47)<v1>:41000,
172.17.0.8(server-1:47)<v1>:41000, 172.17.0.8(server-1:47)<v1>:41000, 172.17.0.4(server-0:65)<v1>:41000 172.17.0.9(server-1:46)<v1>:41000 | 32000 | 8 | 172.17.0.8(server-1:47)<v1>:41000, 172.17.0.4(server-0:65)<v1>:41000, 172.17.0.4(server-0:65)<v1>:41000,
172.17.0.8(server-1:47)<v1>:41000, 172.17.0.4(server-0:65)<v1>:41000, 172.17.0.4(server-0:65)<v1>:41000, 172.17.0.4(server-0:65)<v1>:41000, 172.17.0.8(server-1:47)<v1>:41000 |
But after some time, connections from one of the sender are closed. Connections from cluster-1/server-1 have dissapeared from cluster-2/server-1 list of connected senders:
Cluster-2 gfsh>list gateways
GatewayReceiver Section
Member | Port | Sender Count | Senders Connected
--------------------------------- | ----- | ------------ | ------------------------------------------------------------------------------------------------------------
172.17.0.5(server-0:65)<v1>:41000 | 32000 | 6 | 172.17.0.4(server-0:65)<v1>:41000, 172.17.0.8(server-1:47)<v1>:41000, 172.17.0.8(server-1:47)<v1>:41000,
172.17.0.8(server-1:47)<v1>:41000, 172.17.0.8(server-1:47)<v1>:41000, 172.17.0.4(server-0:65)<v1>:41000 172.17.0.9(server-1:46)<v1>:41000 | 32000 | 5 | 172.17.0.4(server-0:65)<v1>:41000, 172.17.0.4(server-0:65)<v1>:41000, 172.17.0.4(server-0:65)<v1>:41000,
172.17.0.4(server-0:65)<v1>:41000, 172.17.0.4(server-0:65)<v1>:41000 |
Looking for ClientHealtMonitor logs on both servers:
root@server-0:/# grep ClientHealthMonitor server-0/server-0.log
[info 2020/03/10 11:13:38.546 GMT <main> tid=0x1] ClientHealthMonitorThread maximum allowed time between pings: 60000
root@server-1:/# grep ClientHealthMonitor server-1/server-1.log
[info 2020/03/10 11:13:38.700 GMT <main> tid=0x1] ClientHealthMonitorThread maximum allowed time between pings: 60000
[warn 2020/03/10 11:14:52.763 GMT <ClientHealthMonitor Thread> tid=0x39] ClientHealthMonitor: Unregistering client with member id identity(172.17.0.8(server-1:47)<v1>:41000,connection=1 due to: Unknown reason
[warn 2020/03/10 11:14:52.763 GMT <ClientHealthMonitor Thread> tid=0x39] Monitoring client with member id identity(172.17.0.8(server-1:47)<v1>:41000,connection=1. It had been 60595 ms since the latest heartbeat. Max interval is 60000. Terminated client.
|
And some minutes later, all connections are lost:
Cluster-1 gfsh>list gateways
GatewaySender Section
GatewaySender Id | Member | Remote Cluster Id | Type | Status | Queued Events | Receiver Location
---------------- | --------------------------------- | ----------------- | -------- | ---------------------- | ------------- | --------------------------------------------------------------
sender-to-2 | 172.17.0.4(server-0:65)<v1>:41000 | 2 | Parallel | Running, not Connected | 0 | receiver-site2-service.geode-cluster-2.svc.cluster.local:32000
sender-to-2 | 172.17.0.8(server-1:47)<v1>:41000 | 2 | Parallel | Running, not Connected | 0 | receiver-site2-service.geode-cluster-2.svc.cluster.local:32000
Cluster-2 gfsh>list gateways
GatewayReceiver Section
Member | Port | Sender Count | Senders Connected
--------------------------------- | ----- | ------------ | -----------------
172.17.0.5(server-0:65)<v1>:41000 | 32000 | 0 |
172.17.0.9(server-1:46)<v1>:41000 | 32000 | 0 |
|
Checking the logs again, we can see new logs from the ClientHealthMonitor:
root@server-0:/# grep ClientHealthMonitor server-0/server-0.log
[info 2020/03/10 11:13:38.546 GMT <main> tid=0x1] ClientHealthMonitorThread maximum allowed time between pings: 60000
[warn 2020/03/10 11:20:12.203 GMT <ServerConnection on port 32000 Thread 3> tid=0x45] ClientHealthMonitor: Unregistering client with member id identity(172.17.0.8(server-1:47)<v1>:41000,connection=1 due to: The connection has been reset while reading the header
[warn 2020/03/10 11:22:22.336 GMT <ServerConnection on port 32000 Thread 6> tid=0x4c] ClientHealthMonitor: Unregistering client with member id identity(172.17.0.4(server-0:65)<v1>:41000,connection=1 due to: The connection has been reset while reading the header
root@server-1:/# grep ClientHealthMonitor server-1/server-1.log
[info 2020/03/10 11:13:38.700 GMT <main> tid=0x1] ClientHealthMonitorThread maximum allowed time between pings: 60000
[warn 2020/03/10 11:14:52.763 GMT <ClientHealthMonitor Thread> tid=0x39] ClientHealthMonitor: Unregistering client with member id identity(172.17.0.8(server-1:47)<v1>:41000,connection=1 due to: Unknown reason
[warn 2020/03/10 11:14:52.763 GMT <ClientHealthMonitor Thread> tid=0x39] Monitoring client with member id identity(172.17.0.8(server-1:47)<v1>:41000,connection=1. It had been 60595 ms since the latest heartbeat. Max interval is 60000. Terminated client.
[warn 2020/03/10 11:22:13.064 GMT <ClientHealthMonitor Thread> tid=0x39] ClientHealthMonitor: Unregistering client with member id identity(172.17.0.4(server-0:65)<v1>:41000,connection=1 due to: Unknown reason
[warn 2020/03/10 11:22:13.065 GMT <ClientHealthMonitor Thread> tid=0x39] Monitoring client with member id identity(172.17.0.4(server-0:65)<v1>:41000,connection=1. It had been 60747 ms since the latest heartbeat. Max interval is 60000. Terminated client.
|
Test 2:
Cluster-1 gfsh>list members
Member Count : 3
Name | Id
--------- | ------------------------------------------------------------
server-0 | 172.17.0.4(server-0:69)<v1>:41000
locator-0 | 172.17.0.6(locator-0:26:locator)<ec><v0>:41000 [Coordinator]
server-1 | 172.17.0.8(server-1:46)<v1>:41000
Cluster-1 gfsh>list gateways
GatewaySender Section
GatewaySender Id | Member | Remote Cluster Id | Type | Status | Queued Events | Receiver Location
---------------- | --------------------------------- | ----------------- | -------- | --------------------- | ------------- | --------------------------------------------------------------
sender-to-2 | 172.17.0.4(server-0:69)<v1>:41000 | 2 | Parallel | Running and Connected | 0 | receiver-site2-service.geode-cluster-2.svc.cluster.local:32000
sender-to-2 | 172.17.0.8(server-1:46)<v1>:41000 | 2 | Parallel | Running and Connected | 0 | receiver-site2-service.geode-cluster-2.svc.cluster.local:32000
Cluster-2 gfsh>list members
Member Count : 3
Name | Id
--------- | ------------------------------------------------------------
server-0 | 172.17.0.5(server-0:65)<v1>:41000
locator-0 | 172.17.0.7(locator-0:24:locator)<ec><v0>:41000 [Coordinator]
server-1 | 172.17.0.9(server-1:51)<v1>:41000
Cluster-2 gfsh>list gateways
GatewayReceiver Section
Member | Port | Sender Count | Senders Connected
--------------------------------- | ----- | ------------ | -------------------------------------------------------------------------------------------------------------------------------------------------
172.17.0.5(server-0:65)<v1>:41000 | 32000 | 7 | 172.17.0.8(server-1:46)<v1>:41000, 172.17.0.8(server-1:46)<v1>:41000, 172.17.0.8(server-1:46)<v1>:41000, 172.17.0.4(server-0:69)<v1>:41000,
172.17.0.4(server-0:69)<v1>:41000, 172.17.0.8(server-1:46)<v1>:41000, 172.17.0.4(server-0:69)<v1>:41000 172.17.0.9(server-1:51)<v1>:41000 | 32000 | 7 | 172.17.0.4(server-0:69)<v1>:41000, 172.17.0.4(server-0:69)<v1>:41000, 172.17.0.8(server-1:46)<v1>:41000, 172.17.0.8(server-1:46)<v1>:41000,
172.17.0.4(server-0:69)<v1>:41000, 172.17.0.8(server-1:46)<v1>:41000, 172.17.0.4(server-0:69)<v1>:41000 |
And after some seconds:
Cluster-2 gfsh>list gateways
GatewayReceiver Section
Member | Port | Sender Count | Senders Connected
--------------------------------- | ----- | ------------ | -------------------------------------------------------------------------------------------------------------------------------------------------
172.17.0.5(server-0:65)<v1>:41000 | 32000 | 0 |
172.17.0.9(server-1:51)<v1>:41000 | 32000 | 7 | 172.17.0.4(server-0:69)<v1>:41000, 172.17.0.4(server-0:69)<v1>:41000, 172.17.0.8(server-1:46)<v1>:41000, 172.17.0.8(server-1:46)<v1>:41000,
172.17.0.4(server-0:69)<v1>:41000, 172.17.0.8(server-1:46)<v1>:41000, 172.17.0.4(server-0:69)<v1>:41000 |
Logs of the servers. In this test, both senders were considered down by one of the receivers:
root@server-0:/# grep ClientHealthMonitor server-0/server-0.log [info 2020/03/10 14:02:34.130 GMT <main> tid=0x1] ClientHealthMonitorThread maximum allowed time between pings: 60000 [warn 2020/03/10 14:03:56.191 GMT <ClientHealthMonitor Thread> tid=0x37] ClientHealthMonitor: Unregistering client with member id identity(172.17.0.8(server-1:46)<v1>:41000,connection=1 due to: Unknown reason [warn 2020/03/10 14:03:56.192 GMT <ClientHealthMonitor Thread> tid=0x37] Monitoring client with member id identity(172.17.0.8(server-1:46)<v1>:41000,connection=1. It had been 60507 ms since the latest heartbeat. Max interval is 60000. Terminated client. [warn 2020/03/10 14:03:56.194 GMT <ClientHealthMonitor Thread> tid=0x37] ClientHealthMonitor: Unregistering client with member id identity(172.17.0.4(server-0:69)<v1>:41000,connection=1 due to: Unknown reason [warn 2020/03/10 14:03:56.194 GMT <ClientHealthMonitor Thread> tid=0x37] Monitoring client with member id identity(172.17.0.4(server-0:69)<v1>:41000,connection=1. It had been 60444 ms since the latest heartbeat. Max interval is 60000. Terminated client.
root@server-1:/# grep ClientHealthMonitor server-1/server-1.log [info 2020/03/10 14:02:34.275 GMT <main> tid=0x1] ClientHealthMonitorThread maximum allowed time between pings: 60000 |
And some minutes later:
Cluster-2 gfsh>list gateways
GatewayReceiver Section
Member | Port | Sender Count | Senders Connected
--------------------------------- | ----- | ------------ | -------------------------------------------------------------------------------------------------------
172.17.0.5(server-0:65)<v1>:41000 | 32000 | 0 |
172.17.0.9(server-1:51)<v1>:41000 | 32000 | 3 | 172.17.0.8(server-1:46)<v1>:41000, 172.17.0.8(server-1:46)<v1>:41000, 172.17.0.8(server-1:46)<v1>:41000
|
Now ClientHealthMonitor is closing connections in server-1, but in this time it does not seem to be related to a ping problem:
root@server-1:/# grep ClientHealthMonitor server-1/server-1.log
[info 2020/03/10 14:02:34.275 GMT <main> tid=0x1] ClientHealthMonitorThread maximum allowed time between pings: 60000
[warn 2020/03/10 14:15:30.846 GMT <ServerConnection on port 32000 Thread 4> tid=0x4a] ClientHealthMonitor: Unregistering client with member id identity(172.17.0.4(server-0:69)<v1>:41000,connection=1 due to: The connection has been reset while reading the header
|
Anti-Goals
What is outside the scope of what the proposal is trying to solve?
...
Gw sender pings not reaching gw receivers
...
We think the reason behind the issue of the pings is the way they are created. When a new server connection is established, a new PingTask is created and will be in charge of running the PingOp:
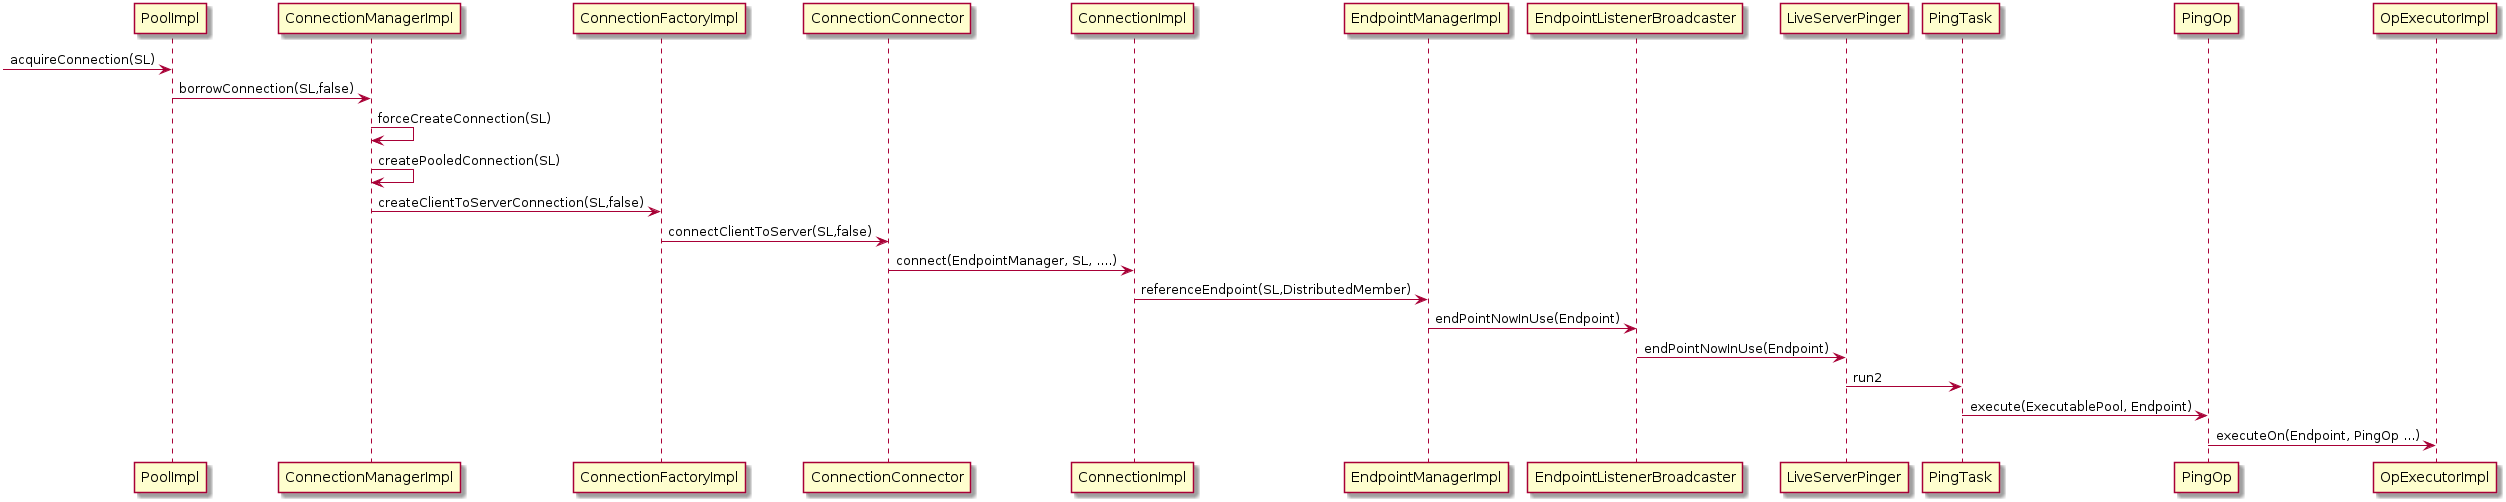 Image Added
and
Changes and Additions to Public Interfaces
...