THIS IS A TEST INSTANCE. ALL YOUR CHANGES WILL BE LOST!!!!
...
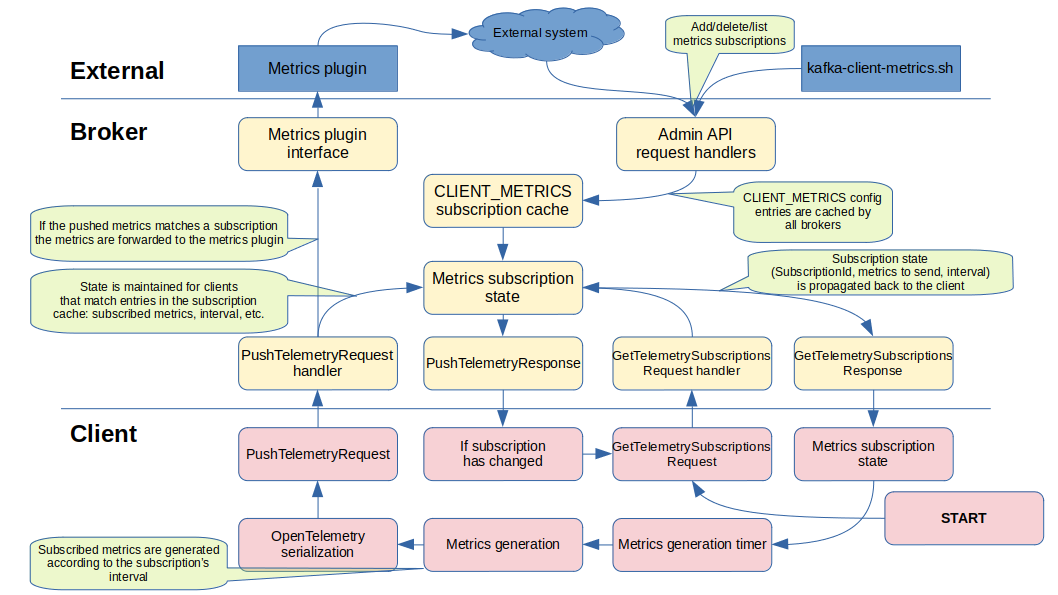
The SubscriptionId is a unique identifier for a client instance's subscription set, the id is generated by calculating a CRC32 of the configured metrics subscriptions matching the given client including the NextPushMsPushIntervalMs, XORed with the ClientInstanceId. This SubscriptionId is returned to the client in the GetTelemetrySubscriptionsResponse and the client passes that SubscriptionId in each subsequent PushTelemetryRequest for those received metrics. If the configured subscriptions are updated and resulting in a change for a client instance, the SubscriptionId is recalculated. Upon the next PushTelemetryRequest using the previous SubscriptionId, the broker will find that the received and expected SubscriptionIds differ and it will return UnknownSubscriptionId back to the client. When a client receives this error code it will immediately send a GetTelemetrySubscriptionsRequest to retrieve the new subcription set along with a new SubscriptionId.
...
| Code Block |
|---|
/**
 * A {@link MetricsReporter} may implement this interface to indicate support for collecting client telemetry on the server side
 */
@InterfaceStability.Evolving
public interface ClientTelemetry {

    /**
     * Called by the broker to create a ClientTelemetryReceiver instance.
     * This instance may be cached by the broker.
     *
     * This method will always be called after the initial call to
     * {@link MetricsReporter#contextChange(MetricsContext)}
     * on the MetricsReporter implementing this interface.
     *
     * @return
     */
    ClientTelemetryReceiver clientReceiver();
}

@InterfaceStability.Evolving
public interface ClientTelemetryReceiver {
    /**
     * Called by the broker when a client reports telemetry. The associated request context can be used
     * by the plugin to retrieve additional client information such as client ids or endpoints.
     *
     * This method may be called from the request handling thread, and as such should avoid blocking.
     *
     * @param context the client request context for the corresponding PushTelemetryRequest api call
     * @param payload the encoded telemetry payload as sent by the client
     */
    void exportMetrics(AuthorizableRequestContext context, ClientTelemetryPayload payload);
}

@InterfaceStability.Evolving
public interface   /**ClientTelemetryPayload {

     * Returns the list of accepted content types for client metric payloads supported by this receiver
     * This method may be used by the broker to inform connecting clients of supported payload formats.
     *
     * <p>e.g.
     * <code>application/x-protobuf+zstd;type=otlp+metrics010</code>,
     * </p>
     *
     * @return collection of supported mime types
     */
    Collection<String> acceptedContentTypes();
}

@InterfaceStability.Evolving
public interface ClientTelemetryPayload {

    String clientInstanceId();

    String contentType();

    ByteBuffer data();
} |
Client API
Retrieve broker-generated client instance id, may be used by application to assist in mapping the client instance id to the application instance through log messages or other means.
| Code Block |
|---|
StringOrError ClientInstance::ClientInstanceId(int timeout_ms) |
If the client has not yet requested a client instance id from the broker this call will block up to the timeout, and trigger an immediate request which is otherwise delayed at client startup (see Client behaviour chapter). If no client instance id can be retrieved within the timeout an error is returned/raised (timeout, feature not supported by broker, auth failure, etc).
Client configuration
enable.metrics.push=true|false (default: true) -Allows disabling the functionality outlined in this proposal which should be enabled by default. (Or enable.telemetry?)
New error codes
TBD
Proposed Changes
Overview
This feature is made up of the following components:
- PushTelemetryRequest|Response - protocol request used by the client to send metrics to any broker it is connected to. The response is used to control push frequency, what metrics the client should push, etc.
- Standardised metrics - a set of standardised metrics that all supporting clients should provide.
- AdminAPI config - the AdminAPI configuration interface with a new CLIENT_METRICS resource type is used to manage metrics subscriptions.
- Client metrics plugin / extending the MetricsReporter interface - a broker plugin interface that performs something meaningful with the metrics. This plugin will typically forward the metrics to a time series database. It is recommended that any broker-side processing is kept to a minimum for scalability and performance reasons.
Client identification (CLIENT_INSTANCE_ID)
The added value of metrics collection is limited if the metrics can’t be tied to an entity, in this case a client instance. While aggregate metrics do provide value in trends and superficial monitoring, for metrics to be truly useful there needs to be a way to identify a particular client instance, where it runs, by who, etc.
While Kafka has a per-request client.id (which most Kafka clients allow to be optionally configured), it is in no way unique and can’t be used, despite its name, to identify a single client instance.
Other seemingly unique identifiers such as authentication principals, client IP source address and port, etc, are either not guaranteed to be unique (there may not be authentication involved or not specific to a single client instance), or not a singleton (a client will have multiple connections to the cluster each connection with its own unique address+port combination).
Since this KIP intends to have metrics enabled by default in supporting clients we can’t rely on the client.id being properly set by the application owner, so we have to resort to some other mechanism for a client instance to uniquely identify itself. There are ideally two entities that we would like to identify in metrics:
- Client instance - a single instance of a producer, consumer, Admin client, etc.
- Application process instance - a single application runtime, which may contain multiple client instances. E.g. a Kafka Streams application with a mix of Admin, producer and consumer instances.
This proposal suggests that as part of the initial metrics handshake the broker generates a unique client instance id UUID4 and returns it to the client. The client must use the returned client instance id for the remaining lifetime of the client instance regardless of which broker it communicates with.
The client should provide an API for the application to read the generated client instance id as to assist in mapping and identification of the client based on the collected metrics. As an alternative or complement the client may log its client instance id as soon as it has acquired it from the cluster. This allows live and post-mortem correlation between collected metrics and a client instance.
As it is not feasible for a Kafka client instance to automatically generate or acquire a unique identity for the application process it runs in, and as we can’t rely on the user to configure one, we treat the application instance id as an optional future nice-to-have that may be included as a metrics label if it has been set by the user. This allows a more direct mapping of client instance to application instance and vice versa. However, due to these constraints, adding an application instance id is outside the scope of this proposal.
Kafka Streams applications have an application.id configured and this identity should be included as the application_id metrics label.
Mapping
Mapping the client instance id to an actual application instance running on a (virtual) machine can be done by inspecting the metrics resource labels, such as the client source address and source port, or security principal, all of which are added by the receiving broker. This will allow the operator together with the user to identify the actual application instance.
Metrics naming and format
The OpenTelemetry specification will be used as the metrics serialization format as well as to define how metrics are constructed when it comes to naming, metric type, etc.
See the OpenTelemetry metrics specification for more information.
Encoding
While the protocol-level request will allow for other metrics formats, Kafka will only ship with OpenTelemetry and it is required for a client that claims support of this KIP to use the OpenTelemetry v0.10 protobuf format.
Metric payloads are encoded as OpenTelemetry ExportMetricsServiceRequest protobuf objects.
Naming
Metrics will be named in a hierarchical format:
<namespace>.<metric.name>
E.g.:
org.apache.kafka.client.producer.partition.queue.bytesThe metric namespace is org.apache.kafka for the standard metrics, vendor/implementation specific metrics may be added in separate namespaces, e.g:
librdkafka.client.producer.xmitq.latencyio.confluent.client.python.object.countThe Apache Kafka Java client would provide implementation specific metrics in:
org.apache.kafka.client.java.producer.socket.buffer.full.countUuid clientInstanceId();
bool isTerminating();
ByteBuffer data();
} |
Client API
Retrieve broker-generated client instance id, may be used by application to assist in mapping the client instance id to the application instance through log messages or other means.
| Code Block |
|---|
StringOrError ClientInstance::ClientInstanceId(int timeout_ms) |
If the client has not yet requested a client instance id from the broker this call will block up to the timeout, and trigger an immediate request which is otherwise delayed at client startup (see Client behaviour chapter). If no client instance id can be retrieved within the timeout an error is returned/raised (timeout, feature not supported by broker, auth failure, etc).
Client configuration
enable.metrics.push=true|false (default: true) -Allows disabling the functionality outlined in this proposal which should be enabled by default. (Or enable.telemetry?)
New error codes
TBD
Proposed Changes
Overview
This feature is made up of the following components:
- GetTelemetrySubscriptionsRequest|Response - protocol request used by the client to acquire its initial Client instance ID and to continually retrieve updated metrics subscriptions.
- PushTelemetryRequest|Response - protocol request used by the client to send metrics to any broker it is connected to.
- Standardised metrics - a set of standardised metrics that all supporting clients should provide.
- AdminAPI config - the AdminAPI configuration interface with a new CLIENT_METRICS resource type is used to manage metrics subscriptions.
- Client metrics plugin / extending the MetricsReporter interface - a broker plugin interface that performs something meaningful with the metrics. This plugin will typically forward the metrics to a time series database. It is recommended that any broker-side processing is kept to a minimum for scalability and performance reasons.
Client identification (CLIENT_INSTANCE_ID)
The value of metrics collection is limited if the metrics can’t be tied to an entity, in this case a client instance. While aggregate metrics do provide some value in trends and superficial monitoring, for metrics to be truly useful there needs to be a way to identify a particular client instance, where it runs, by who, etc.
While Kafka has a per-request client.id (which most Kafka clients allow to be optionally configured), it is in no way unique and can’t be used, despite its name, to identify a single client instance.
Other seemingly unique identifiers such as authentication principals, client IP source address and port, etc, are either not guaranteed to be unique (there may not be authentication involved or not specific to a single client instance), or not a singleton (a client will have multiple connections to the cluster each connection with its own unique address+port combination).
Since this KIP intends to have metrics enabled by default in supporting clients we can’t rely on the client.id being properly set by the application owner, so we have to resort to some other mechanism for a client instance to uniquely identify itself. There are ideally two entities that we would like to identify in metrics:
- Client instance - a single instance of a producer, consumer, Admin client, etc.
- Application process instance - a single application runtime, which may contain multiple client instances. E.g. a Kafka Streams application with a mix of Admin, producer and consumer instances.
This proposal suggests that as part of the initial metrics handshake the broker generates a unique client instance id UUID4 and returns it to the client. The client must use the returned client instance id for the remaining lifetime of the client instance regardless of which broker it communicates with.
The client should provide an API for the application to read the generated client instance id as to assist in mapping and identification of the client based on the collected metrics. As an alternative or complement the client may log its client instance id as soon as it has acquired it from the cluster. This allows live and post-mortem correlation between collected metrics and a client instance.
As it is not feasible for a Kafka client instance to automatically generate or acquire a unique identity for the application process it runs in, and as we can’t rely on the user to configure one, we treat the application instance id as an optional future nice-to-have that may be included as a metrics label if it has been set by the user. This allows a more direct mapping of client instance to application instance and vice versa. However, due to these constraints, adding an application instance id is outside the scope of this proposal.
Kafka Streams applications have an application.id configured and this identity should be included as the application_id metrics label.
Mapping
Mapping the client instance id to an actual application instance running on a (virtual) machine can be done by inspecting the metrics resource labels, such as the client source address and source port, or security principal, all of which are added by the receiving broker. This will allow the operator together with the user to identify the actual application instance.
Metrics naming and format
The OpenTelemetry specification will be used as the metrics serialization format as well as to define how metrics are constructed when it comes to naming, metric type, semantics, etc.
See the OpenTelemetry metrics specification for more information.
Encoding
While future protocol-level request could allow for other metrics formats, Kafka will only ship with OpenTelemetry and it is required for a client that claims support of this KIP to use the OpenTelemetry v0.10 protobuf format.
Metric payloads are encoded as OpenTelemetry ExportMetricsServiceRequest protobuf objects.
Naming
Metrics will be named in a hierarchical format:
<namespace>.<metric.name>
E.g.:
org.apache.kafka.client.producer.partition.queue.bytesThe metric namespace is org.apache.kafka for the standard metrics, vendor/implementation specific metrics may be added in separate namespaces, e.g:
librdkafka.client.producer.xmitq.latencycom.example.client.python.object.countThe Apache Kafka Java client will provide implementation specific metrics in something akin to:
org.apache.kafka.client.java.producer.socket.buffer.full.countMetrics may hold any number of key=value labels which provide the multi-dimensionality of metrics, e.g., Metrics may hold any number of key=value labels which provide the multi-dimensionality of metrics, e.g., the per-partition queue bytes metric described above would have (at least) the following labels:
...
As metric names and labels are highly repeated repetative it is recommended that the serialized metrics are compressed prior to sending them to the broker if the serialized uncompressed size exceeds 1000 bytes.
...
Decompression of the payloads will be handled by the broker prior to forwarding the data to the pluginsmetrics plugin, the broker should expose a suitable decompression API to the metrics plugin for this purpose.
Client behaviour
A client that supports this metric interface and identifies a supportive broker (through detecting at least GetTelemetrySubscriptionsRequestV0 in the ApiVersionResponse) will start off by sending a GetTelemetrySubscriptionsRequest with the ClientInstanceId field set to Null to one randomly selected connected broker to gather its client instance id, the subscribed metrics, the push interval, accepted compression types, etc. This handshake with a Null ClientInstanceId is only performed once for a client instance's lifetime. Sub-sequent GetTelemetrySubscriptionsRequests must include the ClientInstanceId returned in the first response, regardless of broker.
Upon receiving the GetTelemetrySubscriptionsResponse the client shall update its internal metrics collection to match the received subscription (absolute update) and update its push interval timer according to the returned PushIntervalMs. The first metrics push should be randomized between 0.5 * PushIntervalMs and 1.5 * PushIntervalMs, this is to ensure that not all clients start pushing metrics at the same time after a cluster comes back up after some downtime.
If GetTelemetrySubscriptionsResponse.RequestedMetrics indicates that no metrics are desired (RequestedMetrics is Null) the client should send a new GetTelemetrySubscriptionsResponse according to the PushIntervalMsafter the PushIntervalMs has expired.
Client termination
When a client is being shut down it should send its final metrics regardless of the PushIntervalMs time, and only if the client has an active metrics subscription.
...
The metrics should contain the reason for the client termination by including the client.terminating metric with the label “reason” set to a human readable explanation why the client is being shut down, such as “Fatal error: Static consumer fenced by newer instance”, or “Consumer closed by application”.
...
Error code | Reason | Client action | |
..AuthorizationFailed | Client is not permitted to send metrics. | Log a warning to the application and schedule the next GetTelemetrySubscriptionsRequest in 30 minutes. | |
InvalidRecord | Broker failed to decode or validate the client’s encoded metrics. | Log a warning to the application and schedule the next GetTelemetrySubscriptionsRequest to 5 minutes.FunctionalityNotEnabled | |
| UnknownSubscriptionId | Client sent a | GetTelemetrySubscriptionsRequest to a broker which does not have a client metrics receiver plugin configured.Log a warning to the application and schedule the next GetTelemetrySubscriptionsRequest in 30 minutes, preferably on another brokerPushTelemetryRequest with an invalid or outdated SubscriptionId, the configured subscriptions have changed. | Send a GetTelemetrySubscriptionRequest to update the client's subscriptions. |
UnsupportedCompressionType | Client’s compression type is not supported by the broker. | Send a GetTelemetrySubscriptionRequest to get an up to date list of the broker's supported compression types (and any subscription changes). |
The 5 and 30 minute retries are to eventually trigger a retry and avoid having to restart clients if the cluster metrics configuration is disabled temporarily, e.g., by operator error, rolling upgrades, etc.
How non-fatal errors error and warnings are propagated to the application is client and language specific, simply logging the error is sufficient.
...
Receiving broker behaviour
We allow the client clients to send PushTelemetryRequest the GetTelemetrySubscriptions and PushTelemetry requests to any connected broker that reports PushTelemetryRequests support for both these APIs in its ApiVersionResponse.
If PushTelemetryRequestGetTelemetrySubscriptionsRequest.ClientInstanceId is Null the broker will generate a unique id for the client and return it in the response. Sub-sequent PushTelemetryRequests requests from the client to any broker must have the ClientInstanceId set to this returned value.
...
If there is no client metrics receiver plugin configured on the broker it will respond to PushTelemetryRequests with PushTelemetryResponse.ErrorCode GetTelemetrySubscriptionsRequests with RequestedMetrics set to FunctionalityNotEnabledNull and a -1 SubscriptionId. The client should not attempt a PushTelemetryRequest until at least 30 minutes has passed, which should send a new GetTelemetrySubscriptionsRequest after the PushIntervalMs has expired. This allows the metrics receiver to be enabled or disabled without having to restart the broker or reset the client connection.
...
Validation of the encoded metrics is the task of the ClientMetricsReceiver, if the encoding compression type is unsupported the response will be returned with ErrorCode set to UnsupportedEncodingUnsupportedCompressionType. Should decoding or validation of the binary metrics blob fail the ErrorCode will be set to InvalidRecord.
Rate-limiting and
...
PushIntervalMs
The receiving broker’s standard quota-based throttling should operate as usual for PushTelemetryRequest, but in addition to that the PushTelemetryRequest is also subject to rate-limiting based on the calculated next desired NextPushMs PushIntervalMs interval derived from the configured metrics subscriptions. Should the client send a push request prior to expiry of the previously calculated NextPushMs PushIntervalMs the broker will discard the metrics and return a PushTelemetryResponse with the ErrorCode set to RateLimited and NextPushMs set to the remaining time, all other fields should be left blank.
The one exception to this rule is when the client sets the PushTelemetryRequest.Terminating field to true indicating that the client is terminating, in this case the metrics should be accepted by the broker, but a consecutive request must ignore the Terminating field and apply rate-limiting as if the field was not set. The Terminating flag may be reused upon the next expiry of NextPushMsPushIntervalMs.
If the receiving broker has no prior metrics state but at least one matching metrics subscription for a client instance id the first returned NextPushMs is a randomised value between 0 and the lowest metrics interval of the subscription. This attempts to distribute the client metrics pushes in case a large number of clients are started simultaneously.
Request and response size estimations / FIXME / WIP
A producer's typical static (e.g., standard collecting, non-troubleshooting) subscription set may look something like:
- org.apache.kafka/client.producer. // prefix match
- org.apache.kafka/client.connection.errors
- org.apache.kafka/client.request.errors
With a recommended collection interval of 60 seconds.
This gives a PushTelemetryResponse size of roughly respHdr(8) + respFields(20) + clientId(~60) + subscriptionStrings(36 + 43 + 41) = 208 bytes, every 60 seconds, per connected producer client per cluster.
Depending on the amount of metrics the producer implementation provides for the given prefixes, the PushTelemetryRequest with the above metrics would yield FIXME(count it), compressed down to FIXME, every 60 seconds, per connected producer client per cluster. FIXME: For now, 1000 bytes. Compression ratio 8x.
10000 producers with these metrics subscribed, in a 12 broker cluster yields the following numbers:
- 14 PushTelemetryRequests/second per broker
- 15 kb/s requests / broker
- 3 kb/s responses / broker
- 112 kb/s uncompressed OTLP metrics provided to metrics plugin per broker. 1.3MB/s per cluster.
Note: A future optimization could be to cache subscription sets and identify each set by a unique id (e.g., the checksum of the set) generated by the broker and passed down to the client in the PushTelemetryResponse. The client could then quickly see if the subscription needed to be changed or not.
Metrics subscription
Metrics subscription
Metrics subscriptions are configured through the standard Kafka Admin API configuration interface with the new resource-type CLIENT_METRICS, the resource-name is any string - it does not have significance to the metrics system other than to group metrics subscriptions in the configuration interface. The configuration entry value is a JSON document containing an array of prefix-matched metric names (e.g., “client.producer.partition.”) to collect, the push interval in milliseconds, and any client matching selectors used to limit the scope of the subscription. The matching is performed using anchored regexps.
The JSON format is:
| Code Block | ||
|---|---|---|
| ||
{
   "metrics": [
      "<prefix-matched-metric-name>",
      ".."
   ],
   "interval": <push-interval-in-milliseconds>,
   "match": {  // ANDed list of matching criteria. Matches all clients if not included.
     "client_instance_id": "..", // regex
     "client_software_name": "..", // regex
     "client_software_version": ".." // regex
     ..
   }
} |
The match section is optional and allows fine-grained control for which client instances should receive this metrics subscription. The matching selectors are ignored if the resource-name is non-empty.
The supported matching selectors are the same as the client resource labels and broker added labels as listed in the metrics chapter, e.g.: client_id, source_address, client_instance_id, client_software_name, etc.Metrics subscriptions are configured through the standard Kafka Admin API configuration interface with the new resource-type CLIENT_METRICS, the resource-name is a prefix-match of the client instance id (which as stated previously is a concatenation of the client.id and a unique uuid string). The configuration entry name is a prefix-matched metrics name (e.g., “client.producer.partition.”) while the configuration value is the desired collection/push interval in milliseconds.
Example:
| Code Block | ||||
|---|---|---|---|---|
| ||||
$ kafka-configs.sh --bootstrap-server $BROKERS \ --entity-type client_metrics \ --entity-name ‘rdkafka’‘basic_producer_metrics’ \ --altercreate \ --add-config '{ "metrics": ["org.apache.kafka/client.producer.partition.queue.=15000" "], "interval": 15000 }' |
Or Our using the dedicated tool:
| Code Block | ||||
|---|---|---|---|---|
| ||||
# Subscription for a specific client instance id $ kafka-client-metrics.sh --bootstrap-server $BROKERS \ --add \ --id rdkafkaname 'Troubleshoot_b69cc35a' \ # prefix match A descriptive name makes it easier to clean up old subscriptions. --metric org.apache.kafka/client.producer.partition.queue.match client_instance_id=b69cc35a-7a54-4790-aa69-cc2bd4ee4538 \ # prefix-match Match this specific client instance --metric org.apache.kafka/client.producer.partition.queue. \ # prefix-match --metric org.apache.kafka/client.producer.partition.latency \ --interval-ms 15000 |
As the assumption is that the number of CLIENT_METRICS configuration entries will be relatively small (<100), all brokers with a configured metrics plugin will monitor and cache the configuration entries for the CLIENT_METRICS resource type.
As a PushTelemetryRequest is received for a previously unknown client instance id the config cache is queried for any config that prefix-matches the request’s client instance id and the resulting matching configuration entries are compiled into a list of subscribed metrics which is returned in PushTelemetryResponse.DesiredMetrics along with the minimum configured collection interval (this can be improved in future versions by making a scheduler in the broker that interleaves requests/responses per metrics configuration entry, so that each subscribed metric is collected with its configured interval, but in its current form longer-interval metrics are included “for free” if there are shorter-interval metrics in the subscription set).
This client instance specific state is maintained in memory up to MAX(60*1000, NextPushMs * 3) milliseconds and is used to enforce the push interval rate-limiting. There is no persistence of client instance metrics state across broker restarts or between brokers.
Client metrics and metric labels
Clients that support this KIP must provide the following metrics, as long as they’re relevant for the client implementation. These metrics do not need to be comparable between client implementations, e.g., io.wait.time may have somewhat different semantics between Java client and librdkafka.
We try to avoid metrics that are available or derivable from existing broker metrics, such as request rates, etc.
All standard metrics are prefixed with “org.apache.kafka.”, this prefix is omitted from the following tables for brevity.
A client implementation must not add additional metrics or labels under the “org.apache.kafka.” prefix without a corresponding accepted KIP.
Private metrics
The default metrics collection on the client must take extra care not to expose any information about the application and system it runs on as they may identify internal projects, infrastructure, etc, that the user may not want to expose to the Kafka infrastructure owner. This includes information such as hostname, operating system, credentials, runtime environment, etc. None of the metrics defined in this proposal expose any such information.
OpenTelemetry specifies a range of relevant metrics:
Private or host metrics are outside the scope of this specification.
Metric types
The metric types in the following tables correspond to the OpenTelemetry v1 metrics protobuf message types. A short summary:
- Sum - Monotonic total count meter (Counter). Suitable for total number of X counters, e.g., total number of bytes sent.
- Gauge - Non-monotonic current value meter (UpDownCounter). Suitable for current value of Y, e.g., current queue count.
- Histogram - Value distribution meter (ValueRecorder). Suitable for latency values, etc.
For simplicy a client implementation may choose to provide an average value as Gauge instead of a Histogram. These averages should be using the original Histogram metric name + ".avg60s" (or whatever the averaging period is), e.g., "client.request.rtt.avg10s".
Client instance-level metrics
...
Metric name
...
Type
...
Labels
...
Description
...
client.connection.creations
...
Sum
...
FIXME: with broker_id label?
...
Total number of broker connections made.
...
client.connection.count
...
Gauge
...
Current number of broker connections.
...
client.connection.errors
...
Sum
...
reason
...
Total number of broker connection failures. Label ‘reason’ indicates the reason:
disconnect - remote peer closed the connection.
auth - authentication failure.
TLS - TLS failure.
timeout - client request timeout.
close - client closed the connection.
...
client.request.rtt
...
Histogram
...
broker_id
...
Average request latency / round-trip-time to broker and back
...
client.request.queue.latency
...
Histogram
...
broker_id
...
Average request queue latency waiting for request to be sent to broker.
...
client.request.queue.count
...
Gauge
...
broker_id
...
Number of requests in queue waiting to be sent to broker.
...
client.request.success
...
Sum
...
broker_id
...
Number of successful requests to broker, that is where a response is received without no request-level error (but there may be per-sub-resource errors, e.g., errors for certain partitions within an OffsetCommitResponse).
...
client.request.errors
...
Sum
...
broker_id
reason
...
Number of failed requests.
Label ‘reason’ indicates the reason:
timeout - client timed out the request,
disconnect - broker connection was closed before response could be received,
error - request-level protocol error.
 # Subscription for all kafka-python v1.2.* clients
 # A unique name is automatically generated when --name is omitted.
 $ kafka-client-metrics.sh --bootstrap-server $BROKERS \
	--add \
	--metric org.apache.kafka/client.consumer. \  # prefix-match
	--interval-ms 60000
    --match 'client_software_name=kafka-python' \  # match kafka-python 1.2.*
    --match 'client_software_version=1\.2\..*'
|
As the assumption is that the number of CLIENT_METRICS configuration entries will be relatively small (<100), all brokers with a configured metrics plugin will monitor and cache the configuration entries for the CLIENT_METRICS resource type.
As a GetTelemetrySubscriptionsRequest is received for a previously unknown client instance id the CLIENT_METRICS config cache is scanned for any configured metric subscriptions whose match selectors match that of the client. The resulting matching configuration entries are compiled into a list of subscribed metrics which is returned in GetTelemetrySubscriptionsResponse.RequestedMetrics along with the minimum configured collection interval (this can be improved in future versions by including a per-metric interval so that each subscribed metric is collected with its configured interval, but in its current form longer-interval metrics are included “for free” if there are shorter-interval metrics in the subscription set). The a CRC32 checksum is also calculated based on the compiled metrics and is returned as the SubscriptionId in the response, as well as stored in the per-client-instance cache on the broker to track configuration changes.
This client instance specific state is maintained in broker memory up to MAX(60*1000, PushIntervalMs * 3) milliseconds and is used to enforce the push interval rate-limiting. There is no persistence of client instance metrics state across broker restarts or between brokers.
Client metrics and metric labels
Clients that support this KIP must provide the following metrics, as long as they’re relevant for the client implementation. These metrics do not need to be strictly comparable between client implementations, e.g., io.wait.time may have somewhat different semantics between Java client and librdkafka, but should have the same meaning.
We try to avoid metrics that are available or derivable from existing broker metrics, such as request rates, etc.
All standard metrics are prefixed with “org.apache.kafka.”, this prefix is omitted from the following tables for brevity.
A client implementation must not add additional metrics or labels under the “org.apache.kafka.” prefix without a corresponding accepted KIP.
Private metrics
The default metrics collection on the client must take extra care not to expose any information about the application and system it runs on as they may identify internal projects, infrastructure, etc, that the user may not want to expose to the Kafka infrastructure owner. This includes information such as hostname, operating system, credentials, runtime environment, etc. None of the metrics defined in this proposal expose any such information.
OpenTelemetry specifies a range of relevant metrics:
Private or host metrics are outside the scope of this specification.
Metric types
The metric types in the following tables correspond to the OpenTelemetry v1 metrics protobuf message types. A short summary:
- Sum - Monotonic total count meter (Counter). Suitable for total number of X counters, e.g., total number of bytes sent.
- Gauge - Non-monotonic current value meter (UpDownCounter). Suitable for current value of Y, e.g., current queue count.
- Histogram - Value distribution meter (ValueRecorder). Suitable for latency values, etc.
For simplicy a client implementation may choose to provide an average value as Gauge instead of a Histogram. These averages should be using the original Histogram metric name + ".avg60s" (or whatever the averaging period is), e.g., "client.request.rtt.avg10s".
Client instance-level metrics
Metric name | Type | Labels | Description |
client.connection.creations | Sum | broker_id | Total number of broker connections made. |
client.connection.count | Gauge | Current number of broker connections. | |
client.connection.errors | Sum | reason | Total number of broker connection failures. Label ‘reason’ indicates the reason: disconnect - remote peer closed the connection. auth - authentication failure. TLS - TLS failure. timeout - client request timeout. close - client closed the connection. |
client.request.rtt | Histogram | broker_id | Average request latency / round-trip-time to broker and back |
client.request.queue.latency | Histogram | broker_id | Average request queue latency waiting for request to be sent to broker. |
client.request.queue.count | Gauge | broker_id | Number of requests in queue waiting to be sent to broker. |
client.request.success | Sum | broker_id | Number of successful requests to broker, that is where a response is received without no request-level error (but there may be per-sub-resource errors, e.g., errors for certain partitions within an OffsetCommitResponse). |
client.request.errors | Sum | broker_id reason | Number of failed requests. Label ‘reason’ indicates the reason: timeout - client timed out the request, disconnect - broker connection was closed before response could be received, error - request-level protocol error. |
client.io.wait.time | Histogram | Amount of time waiting for socket I/O writability (POLLOUT). A high number indicates socket send buffer congestion. |
As the client will not know the broker id of its bootstrap servers the broker_id label should be set to to the negative index of the broker in the client's bootstrap.servers list, starting at -1.
Client instance-level Producer
...
client.io.wait.time
...
Histogram
...
Amount of time waiting for socket I/O writability (POLLOUT). A high number indicates socket send buffer congestion.
...
Client instance-level Producer metrics
...
Metric name
...
Type
...
Labels
...
Description
...
client.producer.record.bytes
...
Gauge
...
Total number of record memory currently in use by producer. This includes the record fields (key, value, etc) as well as any implementation specific overhead (objects, etc).
...
client.producer.record.count
...
Gauge
...
Total number of records currently handled by producer.
...
client.producer.queue.max.bytes
...
Gauge
...
Total amount of queue/buffer memory allowed on the producer queue(s).
...
client.producer.queue.bytes
...
Gauge
...
Current amount of memory used in producer queues.
...
client.producer.queue.max.messages
...
Gauge
...
Maximum amount of messages allowed on the producer queue(s).
...
client.producer.queue.messages
...
Gauge
...
Current number of messages on the producer queue(s).
...
metrics
Metric name | Type | Labels | Description | ||||||||||||||||||||
client.consumerproducer.pollrecord.intervalbytes | Histogram | The interval at which the application calls poll(), in seconds. | client.consumer.poll.last | Gauge | The number of seconds since the last poll() invocation. | client.consumer.poll.latency | Histogram | The time it takes poll() to return a new message to the application | client.consumer.commit.count | Sum | Number of commit requests sent. | client.consumer.group.assignment.strategy | String | Current group assignment strategy in use. | client.consumer.group.assignment.partition.count | Gauge | Number of currently assigned partitions to this consumer by the group leader. | client.consumer.assignment.partition.count | Gauge | Number of currently assigned partitions to this consumer, either through the group protocol or through assign(). | client.consumer.group.rebalance.count | Sum | Number of group rebalances. |
| client.consumer.group.error.count | Sum | error | Consumer group error counts. The error label depicts the actual error, e.g., "MaxPollExceeded", "HeartbeatTimeout", etc. | client.consumer.record.queue.count | Gauge | Number of records in consumer pre-fetch queue. | client.consumer.record.queue.bytes | Gauge | Amount of record memory in consumer pre-fetch queue. This may also include per-record overhead. | client.consumer.record.application.count | Sum | Number of records consumed by application. | client.consumer.record.application.bytes | Sum | Memory of records consumed by application. | client.consumer.fetch.latency | Histogram | FetchRequest latency. | client.consumer.fetch.count | Count | Total number of FetchRequests sent. | client.consumer.fetch.failures | Count | Total number of FetchRequest failures. |
Client topic-level Producer metrics
Gauge | Total number of record memory currently in use by producer. This includes the record fields (key, value, etc) as well as any implementation specific overhead (objects, etc). | ||
client.producer.record.count | Gauge | Total number of records currently handled by producer. | |
client.producer.queue.max.bytes | Gauge | Total amount of queue/buffer memory allowed on the producer queue(s). | |
client.producer.queue.bytes | Gauge | Current amount of memory used in producer queues. | |
client.producer.queue.max.messages | Gauge | Maximum amount of messages allowed on the producer queue(s). | |
client.producer.queue.messages | Gauge | Current number of messages on the producer queue(s). |
Client instance-level Consumer metrics
Metric name | Type | Labels | Description |
client.consumer.poll.interval | Histogram | The interval at which the application calls poll(), in seconds. | |
client.consumer.poll.last | Gauge | The number of seconds since the last poll() invocation. | |
client.consumer.poll.latency | Histogram | The time it takes poll() to return a new message to the application | |
client.consumer.commit.count | Sum | Number of commit requests sent. | |
| client.consumer.group.assignment.strategy | String | Current group assignment strategy in use. | |
client.consumer.group.assignment.partition.count | Gauge | Number of currently assigned partitions to this consumer by the group leader. | |
client.consumer.assignment.partition.count | Gauge | Number of currently assigned partitions to this consumer, either through the group protocol or through assign(). | |
client.consumer.group.rebalance.count | Sum | Number of group rebalances. | |
| client.consumer.group.error.count | Sum | error | Consumer group error counts. The error label depicts the actual error, e.g., "MaxPollExceeded", "HeartbeatTimeout", etc. |
client.consumer.record.queue.count | Gauge | Number of records in consumer pre-fetch queue. | |
client.consumer.record.queue.bytes | Gauge | Amount of record memory in consumer pre-fetch queue. This may also include per-record overhead. | |
client.consumer.record.application.count | Sum | Number of records consumed by application. | |
client.consumer.record.application.bytes | Sum | Memory of records consumed by application. | |
client.consumer.fetch.latency | Histogram | FetchRequest latency. | |
client.consumer.fetch.count | Count | Total number of FetchRequests sent. | |
client.consumer.fetch.failures | Count | Total number of FetchRequest failures. |
Client topic-level Producer metrics
Metric name | Type | Labels | Description |
client.producer.partition.queue.bytes | Gauge | ||
Metric name | Type | Labels | Description |
client.producer.partition.queue.bytes | Gauge | topic partition acks=all|none|leader | Number of bytes queued on partition queue. |
client.producer.partition.queue.count | Gauge | topic partition acks=all|none|leader | Number of records queued on partition queue. |
client.producer.partition.latency | Histogram | topic partition acks=all|none|leader | Total produce record latency, from application calling send()/produce() to ack received from broker. |
client.producer.partition.queue.latency | Histogram | topic partition acks=all|none|leader | Time between send()/produce() and record being sent to broker. |
client.producer.partition.record.retries | Sum | topic partition acks=all|none|leader | Number of ProduceRequest retriesbytes queued on partition queue. |
client.producer.partition.recordqueue.failurescount | SumGauge | topic partition acks=all|none|leader reason | Number of records that permanently failed delivery. Reason is a short string representation of the reason, which is typically the name of a Kafka protocol error code, e.g., “RequestTimedOut”.queued on partition queue. |
client.producer.partition.record.successlatency | SumHistogram | topic partition acks=all|none|leader | Number of records that have been successfully produced. |
...
Host process metrics (optional)
These metrics provide runtime information about the operating system process the client runs in.
...
Metric name
...
Type
...
Labels
...
Description
...
client.process.memory.bytes
...
Gauge
...
Current process/runtime memory usage (RSS, not virtual).
...
client.process.cpu.user.time
...
Sum
...
User CPU time used (seconds).
...
client.process.cpu.system.time
...
Sum
...
System CPU time used (seconds).
...
client.process.pid
...
Gauge
...
The process id. Can be used, in conjunction with the client host name to map multiple client instances to the same process.
Standard client resource labels
...
Label name
...
Description
...
client_software_name
...
The client’s implementation name.
...
client_software_version
...
The client’s version
...
client_instance_id
...
The generated CLIENT_INSTANCE_ID.
...
client_id
...
...
client_rack
...
client.rack (if configured)
...
group_id
...
group.id (consumer)
...
group_instance_id
...
group.instance.id (consumer)
...
group_member_id
...
Group member id (if any, consumer)
...
transactional_id
...
transactional.id (producer)
Total produce record latency, from application calling send()/produce() to ack received from broker. | |||
client.producer.partition.queue.latency | Histogram | topic partition acks=all|none|leader | Time between send()/produce() and record being sent to broker. |
client.producer.partition.record.retries | Sum | topic partition acks=all|none|leader | Number of ProduceRequest retries. |
client.producer.partition.record.failures | Sum | topic partition acks=all|none|leader reason | Number of records that permanently failed delivery. Reason is a short string representation of the reason, which is typically the name of a Kafka protocol error code, e.g., “RequestTimedOut”. |
client.producer.partition.record.success | Sum | topic partition acks=all|none|leader | Number of records that have been successfully produced. |
The “partition” label should be -1 for not yet partitioned messages, as they are not yet assigned to a partition queue.
Host process metrics (optional)
These metrics provide runtime information about the operating system process the client runs in.
Metric name | Type | Labels | Description |
client.process.memory.bytes | Gauge | Current process/runtime memory usage (RSS, not virtual). | |
client.process.cpu.user.time | Sum | User CPU time used (seconds). | |
client.process.cpu.system.time | Sum | System CPU time used (seconds). | |
| client.process.io.wait.time | Sum | IO wait time (seconds). | |
client.process.pid | Gauge | The process id. Can be used, in conjunction with the client host name to map multiple client instances to the same process. |
Standard client resource labels
Label name | Description |
| application_id | application.id (Kafka Streams only) |
client_rack | client.rack (if configured) |
group_id | group.id (consumer) |
group_instance_id | group.instance.id (consumer) |
group_member_id | Group member id (if any, consumer) |
transactional_id | transactional.id (producer) |
Broker-added labels
The following labels are added by the broker as metrics are received
Label name | Description |
client_instance_id | The generated CLIENT_INSTANCE_ID. |
| client_id | client.id as reported in the Kafka protocol header. |
client_software_name | The client’s implementation name as reported in ApiVersionRequest. |
client_software_version | The client’s version as reported in ApiVersionRequest. |
client_source_address | The client connection’s source address. |
client_source_port | The client connection’s source port. |
principal | Client’s security principal. Content depends on authentication method. |
broker_id | Receiving broker’s node-id. |
Security
Since client metric subscriptions are primarily aimed at the infrastructure operator that is managing the Kafka cluster it should be sufficient to limit the config control operations to the CLUSTER resource.
There will be no permission checks on the PushTelemetryRequest itself.
API Request | Resource | ACL |
DescribeConfigs | CLUSTER | DESCRIBE,READ |
AlterConfigs | CLUSTER | WRITE |
| GetTelemetrySubscriptionsRequest | N/A | N/A |
PushTelemetryRequest | N/A | N/A |
See the Private metrics chapter above for privacy/integrity.
Tools
kafka-client-metrics.sh is a wrapper tool around kafka-configs.sh that makes it easier to set up metric subscriptions.
| Code Block | ||||
|---|---|---|---|---|
| ||||
bin/kafka-client-metrics.sh [arguments] --bootstrap-server <brokers>

List configured metrics:
	--list
    [--name <descriptive-config-name>]

Add metrics:
	--add
     [ --name <descriptive-config-name> ]
	 --metric <metric-prefix>..   # may repeat
	 --interval-ms <interval>
     --match <selector=regex>  # optional, may repeat

Delete metrics:
	--delete
--name <descriptive-config-name> |
Broker-added labels
The following labels are added by the broker as metrics are received
...
Label name
...
Description
...
client_source_address
...
The client connection’s source address.
...
client_source_port
...
The client connection’s source port.
...
principal
...
Client’s security principal. Content depends on authentication method.
...
broker_id
...
Receiving broker’s node-id.
Security
Since client metric subscriptions are primarily aimed at the infrastructure operator that is managing the Kafka cluster it should be sufficient to limit the config control operations to the CLUSTER resource.
There will be no permission checks on the PushTelemetryRequest itself.
...
API Request
...
Resource
...
ACL
...
DescribeConfigs
...
CLUSTER
...
DESCRIBE,READ
...
AlterConfigs
...
CLUSTER
...
WRITE
...
PushTelemetryRequest
...
N/A
...
N/A
See the Private metrics chapter above for privacy/integrity.
Tools
A wrapper tool around kafka-configs.sh that makes it easier to set up metric subscriptions.
| Code Block | ||
|---|---|---|
| bash | bash | bin/kafka-client-metrics.sh [arguments] --bootstrap-server <brokers>
List configured metrics:
--list
[--id <client-instance-id> | --id-prefix <prefix-match>]
Add metrics:
--add
--id <client-instance-id> | --id-prefix <prefix-match>
--metric <metric-prefix>..
--interval-ms <interval>
Delete metrics:
--delete
--id <client-instance-id> | --id-prefix <prefix-match>
[--metric <metric-prefix>]..
Example:
# Subscribe to producer partition queue and memory usage
# metrics every 60s from all librdkafka clients.
$ kafka-client-metrics.sh --bootstrap-server localhost:9092 \
--add \
--id-prefix rdkafka \
--metric org.apache.kafka/client.producer.partition. \
--metric librdkafka.client.memory. \
--interval 60000
# For a specific client instance:
$ kafka-client-metrics.sh --bootstrap-server localhost:9092 \
--delete \
--id rdkafka-33E53F93-C6D0-4136-A4A7-6308050AFFF3 \
--metric org.apache.kafka/client.request.errors
# Subscribe to all metrics by providing an empty metric.
$ kafka-client-metrics.sh --bootstrap-server localhost:9092 \
--add \
--id rdkafka-33E53F93-C6D0-4136-A4A7-6308050AFFF3 \
--metric '' \
--interval 120000
# The metrics themselves are not viewable with this CLI tool
# since the storage of metrics is plugin-dependent.
|
Example workflows
Example workflows showcasing how this feature may be used for proactive and reactive purposes.
...
The monitoring system detects an anomaly for CLIENT_INSTANCE_ID=java-producer-1234’s 4e6fb54c-b8e6-4517-889b-e15b99c09c20’s metric org.apache.kafka.client.producer.partition.queue.latency which for more than 180 seconds has exceeded the threshold of 5000 milliseconds.
...
The Kafka operator adds a metrics subscription for metrics matching prefix “org.apache.kafka.client.consumer.” and with the corresponding client._id as resource-name prefixand source_address as metrics matching selectors . Since this is a live troubleshooting case the metrics push interval is set to a low 10 seconds.
The metrics subscription propagates through configuration change notifications to all brokers which update their local metrics subscription config cache and regenerates the SubscriptionId.
Upon the next intervalled PushTelemetryRequest or GetTelemetrySubscriptionsRequest from the consumer the receiving broker checks sees that the SubscriptionId no longer matches its metrics subscription cache and finds that , the consumer’s client instance id prefix-matches that of a configuration entry and responds with a PushTelemetryResponse including the subscribed metrics and a random NextPushMs interval in the range of 0 and the configured interval (10 seconds)client retrieves the new metrics subscription and schedules its next metrics push to a random value between PushIntervalMs * 0.5 .. PushIntervalMs * 1.5.
Upon the next PushTelemetryRequest, which now includes metrics for the subscribed metrics, the metrics are written to the output topic and the NextPushMs PushIntervalMs is adjusted to the configured interval of 10 seconds. This repeats until the metrics subscription configuration is changed.
As the consumer metrics are now being written to the metrics topic the support system reads the metrics, sees that there is an active viewer for the given client.id, and displays the metrics to the operator.
Because the client.id may not be unique there might be metrics from multiple consumers, so the operator adds a local display filter on the source_address and the principal’s user_id labels, which are matched to the labels in the metrics data, and the view is updated to only show the single matching consumer.
The operator identifies an increasing trend in client.consumer.processing.time which indicates slow per-message processing in the application and reports this back to the application owner, ruling out the client and Kafka cluster from the problem space.
The operator removes the metrics subscription for the client.id, which causes the next PushTelemetryResponse to return an empty subscription error indicating that the metrics subscription has changed, causing the client to stop pushing the previously subscribed metricsto get its new subscription which is now back to empty.
Future work
Tracing and logging are outside the scope of this proposal but the use of OpenTelemetry allows for those additional two methods within the same semantics and nomenclature outlined by this proposal.
...
Short of the configuration property to disable telemetry (enable.metrics.telemetrypush=false - enabled by default) there are no user-facing changes to client users.
...