THIS IS A TEST INSTANCE. ALL YOUR CHANGES WILL BE LOST!!!!
...
Being able to centrally monitor and troubleshoot problems with Kafka clients is becoming increasingly important as the use of Kafka is expanding within organizations as well as for hosted Kafka services. The typical Kafka client user is now an application owner with little experience in operating Kafka clients, while the cluster operator has profound Kafka knowledge but little insight in the client application. This is of particular importance for hosted Kafka services.
Troubleshooting Kafka problems is currently an organisationally complex organizationally complex issue, with different teams or even organisations running organizations running the client applications and the brokers. While some organisations may organizations may already have custom collection of existing client metrics in place, most do not and metrics are typically not available when the problem needs to be analysed. Enabling metrics after-the-fact may not be possible without code change to the application, or at least a restart, which typically means the required metrics data is lost.
While the broker already tracks request-level metrics for connected clients, there is a gap in the end-to-end monitoring when it comes to visibility of client internals, be it queue sizes, internal latencies, error counts, and application behaviour (behavior such as message processing rate), etcrates. These are covered by Kafka client metrics, and not application metrics.
This proposal aims to provide a generic and standardised standardized interface through which a cluster operator or an external system may request and a client can push client-side can request metrics, clients can push metrics to the broker, a plugin interface for how those metrics are handled by the broker, and a minimum set of standard pre-defined metrics that a Kafka client should expose through this interface. A supporting client should have metrics enabled by default and not require any extra configuration, and will provide at least the standardised required set of standard metrics as outlined later in this proposal.
One of the key goals of this KIP is to have the proposed metrics and telemetry interface generally available and enabled by default in all of the mainstream Kafka clients, not just the Java client in the Apache Kafka project, allowing troubleshooting and monitoring as needed without interaction from cluster end-users. While metrics are to be enabled by default on the clients, the brokers still need to be configured with a metrics plugin, and metrics subscriptions must be configured on the cluster before any metrics are sent and collected.
User privacy is an important concern and extra care is taken in this proposal to not expose any information that may compromise the privacy of the client user.
Public Interfaces
This KIP introduces the following new public interfaces:
- New PushTelemetryRequest protocol request type.
- Updated metrics receiver interface in the broker to accustom for the new semantics and format.
- A new CLIENT_METRICS ConfigEntry resource type for configuring metrics subscriptions.
- kafka-client-metrics.sh CLI script to configure and list client metrics subscriptions.
Default behaviour
The metric collection is opt-in on the broker and opt-out on the client.
For metrics to be collected a MetricsPlugin (see below) must be configured on the brokers, and at least one metrics subscription must be configured through the Admin API. Only then will metrics subscriptions be propagated to clients, and only then will clients push metrics to the broker. It is thus up to the cluster operator to explicitly enable client metrics collection.
Protocol
| Code Block |
|---|
GetTelemetrySubscriptionsRequestV0 {
 	ClientInstanceId uuid    			// UUID4 unique for this client instance.
										// Must be set to Null on the first request, and to the
										// returned ClientInstanceId from the first response
										// for all subsequent requests to any broker.
}

GetTelemetrySubscriptionsResponseV0 {
 	ThrottleTime int32					// Standard throttling
	ErrorCode int16						// Error code
    ClientInstanceId uuid               // Assigned client instance id if ClientInstanceId was Null in the request, else Null.
    SubscriptionId int32                // Unique identifier for the current subscription set for this client instance.
    AcceptedCompressionTypes Array[int8] // The compression types the broker accepts for PushTelemetryRequest.CompressionType
                                        // as listed in MessageHeaderV2.Attributes.CompressionType. The array will be sorted in
                                        // preference order from higher to lower. The CompressionType of NONE will not be
                                        // present in the response from the broker, though the broker does support uncompressed
                                        // client telemetry if none of the accepted compression codecs are supported by the client.
    PushIntervalMs int32				// Configured push interval, which is the lowest configured interval in the current subscription set.
    DeltaTemporality bool               // If True; monotonic/counter metrics are to be emitted as deltas to previous sample.
                                        // If False; monotonic/counter metrics are to be emitted as cumulative absolute values.
	RequestedMetrics Array[string]		// Requested Metrics prefix string match.
										// Empty array: No metrics subscribed.
										// Array[0] empty string: All metrics subscribed.
										// Array[..]: prefix string match

}

PushTelemetryRequestV0 {
	ClientInstanceId uuid    			// UUID4 unique for this client instance, as retrieved in the first GetTelemetrySubscriptionsRequest.
    SubscriptionId int32                // SubscriptionId from the GetTelemetrySubscriptionsResponse for the collected metrics.
	Terminating bool					// Client is terminating.
    CompressionType int8                // Compression codec used for .Metrics (ZSTD, LZ4, Snappy, GZIP, None).
                                        // Same values as that of the current MessageHeaderV2.Attributes.
	Metrics binary						// Format specified by ContentType, possibly compressed.
}

PushTelemetryResponseV0 {
	ThrottleTime int32					// Standard throttling
	ErrorCode int16						// Error code
}
|
Metrics format
The metrics format for PushTelemetryRequestV0 is OpenTelemetry Protobuf protocol definitions version 0.11.
Future versions of PushTelemetryRequest and GetTelemetrySubscriptionsRequest may include a content-type field to allow for updated OTLP format versions (or additional formats), but this field is currently not included since only one format is specified by this proposal.
SubscriptionId
The SubscriptionId is a unique identifier for a client instance's subscription set, the id is generated by calculating a CRC32 of the configured metrics subscriptions matching the given client including the PushIntervalMs, XORed with the ClientInstanceId. This SubscriptionId is returned to the client in the GetTelemetrySubscriptionsResponse and the client passes that SubscriptionId in each subsequent PushTelemetryRequest for those received metrics. If the configured subscriptions are updated and resulting in a change for a client instance, the SubscriptionId is recalculated. Upon the next PushTelemetryRequest using the previous SubscriptionId, the broker will find that the received and expected SubscriptionIds differ and it will return UnknownSubscriptionId back to the client. When a client receives this error code it will immediately send a GetTelemetrySubscriptionsRequest to retrieve the new subcription set along with a new SubscriptionId.
This mechanism provides a way for the broker to propagate an updated subscription set to the client and is similar to the use of Epochs in other parts of the protocol, but simplified in that no state needs to be persisted - the configured subscription set + client instance id is the identifier itself.
Broker metrics receiver
The broker will expose a plugin interface for client telemetry to be forwarded to or collected by external systems. In particular, since we already collect data in OpenTelemetry format, one goal is to make it possible for a plugin to forward metrics directly to an OpenTelemetry collector.
The existing MetricsReporter plugin interface was built for plugins to pull metrics from the broker, but does not lend itself to the model where the broker pushes metric samples to plugins.
In order to minimize the complexity of additional configuration mechanisms, we are proposing to reuse the existing metrics reporter configuration mechanisms, but allow plugins to implement a new interface (trait) to indicate if they support receiving client telemetry.
This also allows a plugin to reuse the existing labels passed through the MetricsContext (e.g. broker, cluster id, and configured labels) and add them to the OpenTelemetry resource labels as needed.
| Code Block |
|---|
/**
 * A {@link MetricsReporter} may implement this interface to indicate support for collecting client telemetry on the server side
 */
@InterfaceStability.Evolving
public interface ClientTelemetry {

    /**
     * Called by the broker to create a ClientTelemetryReceiver instance.
     * This instance may be cached by the broker.
     *
     * This method will always be called after the initial call to
     * {@link MetricsReporter#contextChange(MetricsContext)}
     * on the MetricsReporter implementing this interface.
     *
     * @return
     */
    ClientTelemetryReceiver clientReceiver();
}

@InterfaceStability.Evolving
public interface ClientTelemetryReceiver {
    /**
     * Called by the broker when a client reports telemetry. The associated request context can be used
     * by the plugin to retrieve additional client information such as client ids or endpoints.
     *
     * This method may be called from the request handling thread, and as such should avoid blocking.
     *
     * @param context the client request context for the corresponding PushTelemetryRequest api call
     * @param payload the encoded telemetry payload as sent by the client
     */
    void exportMetrics(AuthorizableRequestContext context, ClientTelemetryPayload payload);
}

@InterfaceStability.Evolving
public interface ClientTelemetryPayload {

    /**
     * Client's instance id.
     */
    Uuid clientInstanceId();

    /**
     * Indicates whether client is terminating, e.g., the last metrics push from this client instance.
     */
    boolean isTerminating();

    /**
     * Metrics data content-type / serialization format.
     * Currently "application/x-protobuf;type=otlp+metrics0.11"
     */
    String contentType();

    /**
     * Serialized uncompressed metrics data.
     */
    ByteBuffer data();
} |
Client API
Retrieve broker-generated client instance id, may be used by application to assist in mapping the client instance id to the application instance through log messages or other means.
The following method should be added to the Producer, Consumer, and Admin client interfaces;
| Code Block |
|---|
/**
 * @returns the client's assigned instance id used for metrics collection.
 */
public String clientInstanceId(Duration timeout) |
If the client has not yet requested a client instance id from the broker this call will block up to the timeout. If no client instance id can be retrieved within the timeout an error is returned/raised (timeout, feature not supported by broker, auth failure, etc).
Client configuration
enable.metrics.push=true|false (default: true) -Allows disabling the functionality outlined in this proposal which should be enabled by default.
New error codes
UnknownSubscriptionId - See Error handling chapter.
Proposed Changes
Overview
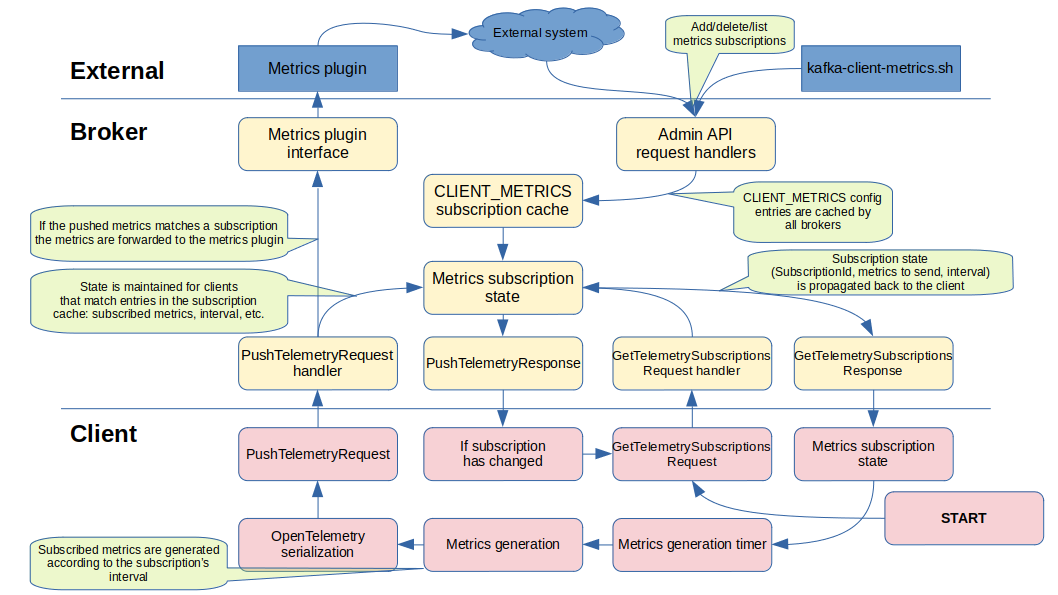
This feature is made up of the following components:
- GetTelemetrySubscriptionsRequest|Response - protocol request used by the client to acquire its initial Client instance ID and to continually retrieve updated metrics subscriptions.
- PushTelemetryRequest|Response - protocol request used by the client to send metrics to any broker it is connected to.
- Standardised metrics - a set of standardised metrics that all supporting clients should provide.
- AdminAPI config - the AdminAPI configuration interface with a new CLIENT_METRICS resource type is used to manage metrics subscriptions.
- Client metrics plugin / extending the MetricsReporter interface - a broker plugin interface that performs something meaningful with the metrics. This plugin will typically forward the metrics to a time series database. It is recommended that any broker-side processing is kept to a minimum for scalability and performance reasons.
Client identification (CLIENT_INSTANCE_ID)
The value of metrics collection is limited if the metrics can’t be tied to an entity, in this case a client instance. While aggregate metrics do provide some value in trends and superficial monitoring, for metrics to be truly useful there needs to be a way to identify a particular client instance, where it runs, by who, etc.
While Kafka has a per-request client.id (which most Kafka clients allow to be optionally configured), it is in no way unique and can’t be used, despite its name, to identify a single client instance.
Other seemingly unique identifiers such as authentication principals, client IP source address and port, etc, are either not guaranteed to be unique (there may not be authentication involved or not specific to a single client instance), or not a singleton (a client will have multiple connections to the cluster each connection with its own unique address+port combination).
Since this KIP intends to have metrics enabled by default in supporting clients we can’t rely on the client.id being properly set by the application owner, so we have to resort to some other mechanism for a client instance to uniquely identify itself. There are ideally two entities that we would like to identify in metrics:
- Client instance - a single instance of a producer, consumer, Admin client, etc.
- Application process instance - a single application runtime, which may contain multiple client instances. E.g. a Kafka Streams application with a mix of Admin, producer and consumer instances.
This proposal suggests that as part of the initial metrics handshake the broker generates a unique client instance id UUID4 and returns it to the client. The client must use the returned client instance id for the remaining lifetime of the client instance regardless of which broker it communicates with.
The client should provide an API for the application to read the generated client instance id as to assist in mapping and identification of the client based on the collected metrics. As an alternative or complement the client may log its client instance id as soon as it has acquired it from the cluster. This allows live and post-mortem correlation between collected metrics and a client instance.
As it is not feasible for a Kafka client instance to automatically generate or acquire a unique identity for the application process it runs in, and as we can’t rely on the user to configure one, we treat the application instance id as an optional future nice-to-have that may be included as a metrics label if it has been set by the user. This allows a more direct mapping of client instance to application instance and vice versa. However, due to these constraints and the need for zero-configuration on the client, adding an application instance id configuration property is outside the scope of this proposal.
Kafka Streams applications have an application.id configured and this identity should be included as the application_id metrics label.
Mapping
Mapping the client instance id to an actual application instance running on a (virtual) machine can be done by inspecting the metrics resource labels, such as the client source address and source port, or security principal, all of which are added by the receiving broker. This will allow the operator together with the user to identify the actual application instance.
Metrics naming and format
The OpenTelemetry specification will be used as the metrics serialization format as well as to define how metrics are constructed when it comes to naming, metric type, semantics, etc.
See the OpenTelemetry metrics specification for more information.
Encoding
While future protocol-level request could allow for other metrics formats, Kafka will only ship with OpenTelemetry and it is required for a client that claims support of this KIP to use the OpenTelemetry v0.11 protobuf format.
Metric payloads are encoded as OpenTelemetry MetricsData protobuf objects.
Naming
Metrics will be named in a hierarchical format:
<namespace>.<metric.name>
E.g.:
org.apache.kafka.client.producer.partition.queue.bytesThe metric namespace is org.apache.kafka for the standard metrics, vendor/implementation specific metrics may be added in separate namespaces, e.g:
librdkafka.client.producer.xmitq.latencycom.example.client.python.object.countThe Apache Kafka Java client will provide implementation specific metrics in something akin to:
org.apache.kafka.client.java.producer.socket.buffer.full.countMetrics may hold any number of key=value labels which provide the multi-dimensionality of metrics, e.g., the per-partition queue bytes metric described above would have (at least) the following labels:
topic=mytopic
partition=3
Sparse metrics
To keep metrics volume down it is recommended that a client only sends metrics with a recorded value.
Metric aggregation temporality
Metrics are to be sent as either DELTA or CUMULATIVE values, depending on the value of DeltaTemporality in the GetTelemetrySubscriptionsResponse.
CUMULATIVE metrics allow for missed/dropped transmits without loss of precision at the cost of increased processing and complexity required in upstream systems.
While clients must support both temporalities, the broker will initially only send GetTelemetrySubscriptionsResponse.DeltaTemporality=True. Configuration properties or extensions to the Metrics plugin interface on the broker to change the temporality is outside the scope of this KIP and may be addressed at a later time as the need arises.
See OTLP specification for more information on temporality.
Serialized size
As an example, the serialized size prior to compression of all producer and standard metrics defined in this KIP for a producer producing to 50 partitions gives approximately 100 kB.
Compression
As metric names and labels are highly repetitive it is recommended that the serialized metrics are compressed prior to sending them to the broker if the serialized uncompressed size exceeds 1000 bytes.
The broker will return a prioritized list of supported compression types in the GetTelemetrySubscriptionsResponse.AcceptedCompressionTypes array, the client is free to pick any supported compression type but should pick the first mutually supported type in the returned list. If the AcceptedCompressionTypes array is empty the client must send metrics uncompressed. The default compression types list as returned from the broker should be: ZStd, LZ4, GZip, Snappy.
The PushTelemtryRequest.CompressionType must then be set to the corresponding compression type value as defined for MessageV2.
Preliminary tests indicate that a compression ratio up to 10x is possible for the standard metrics using ZStd.
Decompression of the metrics data will be performed by the broker prior to passing the data to the metrics plugin.
Client behaviour
A client that supports this metric interface and identifies a supportive broker (through detecting at least GetTelemetrySubscriptionsRequestV0 in the ApiVersionResponse) will start off by sending a GetTelemetrySubscriptionsRequest with the ClientInstanceId field set to Null to one randomly selected connected broker to gather its client instance id, the subscribed metrics, the push interval, accepted compression types, etc. This handshake with a Null ClientInstanceId is only performed once for a client instance's lifetime. Sub-sequent GetTelemetrySubscriptionsRequests must include the ClientInstanceId returned in the first response, regardless of broker.
Upon receiving the GetTelemetrySubscriptionsResponse the client shall update its internal metrics collection to match the received subscription (absolute update) and update its push interval timer according to the returned PushIntervalMs. The first metrics push should be randomized between 0.5 * PushIntervalMs and 1.5 * PushIntervalMs, this is to ensure that not all clients start pushing metrics at the same time after a cluster comes back up after some downtime.
If GetTelemetrySubscriptionsResponse.RequestedMetrics indicates that no metrics are desired (RequestedMetrics is Null) the client should send a new GetTelemetrySubscriptionsResponse after the PushIntervalMs has expired.
If GetTelemetrySubscriptionsResponse.RequestedMetrics is non-empty but does not match any metrics the client provides then the client should PushTelemetryRequests at the indicated PushIntervalMs interval with an empty metrics blob. This is needed so that a broker side metrics plugin can differentiate between non-responsive or buggy clients and clients that don't have metrics matching the subscription set.
Threading
The client will re-use the existing threads that are used for network communication. The existing logic in the poll method of the NetworkClient class issues internal network requests for metadata when needed. The NetworkClient class has been augmented to now also issue internal network requests for telemetry based on the poll interval in the subscription.
The threads that invoke the NetworkClient's poll method are:
KafkaAdminClient: the "admin client runnable" threadKafkaAdminClientcreates a dedicated thread to execute theAdminClientRunnableinner class- The
AdminClientRunnable'sprocessRequestsmethod loops, polling for network requests viaNetworkClient'spollmethod
- The
KafkaConsumer: both the "heart beat" and application threadsKafkaConsumercreates aConsumerNetworkClient(which wraps aNetworkClient) for network communicationKafkaConsumeralso creates aConsumerCoordinatorto manage consumer group members- The
ConsumerCoordinatoris provided with a reference to theConsumerNetworkClientinstance from theKafkaConsumer ConsumerCoordinator(via itsAbstractCoordinatorsuperclass) maintains an inner thread class namedHeartbeatThread- The
HeartbeatThread'srunmethod loops and invokes theConsumerNetworkClient'spollmethod
- The
- The
- The
KafkaConsumer'spollmethod, invoked by the caller on an application thread, also invokes theConsumerNetworkClient'spollmethod - Thus when either the heartbeat thread runs or the application thread polls for new records, the internal
NetworkClient'spollmethod is invoked- Synchronization is performed by the
ConsumerNetworkClientto make sure two threads don't access the innerNetworkClientconcurrently
- Synchronization is performed by the
KafkaProducer: the "sender" thread- The
KafkaProducercreates aSenderto run in a dedicated thread to manage produce requests- The
Senderis provided with a reference to theNetworkClientinstance from theKafkaProducer - The
Sender'srunmethod loops, calling a method namedrunOncein each pass- The
runOncemethod polls for network requests viaNetworkClient'spollmethod
- The
- The
- The
Connection selection
The client may send telemetry requests to any broker, but shall prefer using an already available connection rather than creating a new connection - to keep the number of cluster connections down.
It should also keep using the same broker connection for telemetry requests until the connection goes down, at which time it may choose to reconnect and continue using the same broker, or switch over to another broker connection. Using a persistent connection for PushTelemetryRequests is important so that metrics throttling can be properly performed by the receiving broker, and also avoids maintaining metrics state for the client instance id on multiple brokers.
Client termination
When a client is being shut down it should send its final metrics regardless of the PushIntervalMs time, and only if the client has an active metrics subscription.
The default configuration for an Apache Kafka cluster does not include any metrics subscriptions.
This KIP defines two kinds of metrics: standard metrics and required metrics.
A standard metric is a Kafka client metric which clients that support this KIP should support. The standard metrics are a subset of the Kafka client metrics, selected because they measure concepts which are likely to apply well to any client which implements the Kafka protocol. The Apache Kafka Java client does by definition support all of the standard metrics. Other client implementations should support standard metrics which conceptually make sense.
A required metric is a Kafka client metric which clients that support this KIP must support. The required metrics are a subset of the standards metrics, selected because they have the highest value for monitoring and troubleshooting client performance and whose concepts apply well to all clients which implement the Kafka protocol. The Apache Kafka Java client does by definition support all of the required metrics.
The Apache Kafka client provides the reference implementation of these metrics. To implement these metrics in other clients, the definition of the metrics is provided by the Apache Kafka documentation and ultimately the code.
Defining standard and required metrics makes the monitoring and troubleshooting of clients from various client types because the operator can combine the same metric from all client types. For example, request latencies for all client types are reported in a consistent way. Care has been taken to make the standard metrics as generic as possible, and they should fit most Kafka client implementations.
User privacy is an important concern and extra care is taken in this proposal to not expose any information that may compromise the privacy of the client user.
Proposed Changes
Overview
This feature is made up of the following components:
- GetTelemetrySubscriptions RPC - protocol request used by the client to acquire its initial Client instance ID and to continually retrieve updated metrics subscriptions.
- PushTelemetry RPC - protocol request used by the client to push metrics to any broker it is connected to.
- Standard and required metrics - a set of standardized metrics that all supporting clients should provide.
- AdminAPI config - the AdminAPI configuration interface with a new
CLIENT_METRICSresource type is used to manage metrics subscriptions. - Client metrics plugin / extending the MetricsReporter interface - a broker plugin interface that performs something meaningful with the metrics. This plugin will typically forward the metrics to a time series database. It is recommended that any broker-side processing is kept to a minimum for scalability and performance reasons.
The metric collection is opt-in on the broker and opt-out on the client.
For metrics to be collected, a MetricsPlugin which implements the ClientTelemetry interface must be configured on the brokers, and at least one metrics subscription must be configured through the Admin API. Only then will metrics subscriptions be propagated to clients, and only then will clients push metrics to the broker. It is thus up to the cluster operator to explicitly enable client metrics collection.
Client metrics subscription
A client metrics subscription is the way that the operator chooses which client metrics to collect from the client. It consists of:
- A list of metric name prefixes (in the telemetry metric name format described later)
- The push interval which specifies the frequency of pushing the metrics from the client
- Matching criteria which can be used to filter which clients match the subscription, such as client version
Client identification (CLIENT_INSTANCE_ID)
The value of metrics collection is limited if the metrics can’t be tied to an entity, in this case a client instance. While aggregate metrics do provide some value in trends and superficial monitoring, for metrics to be truly useful there needs to be a way to identify a particular client instance.
While Kafka has a per-request client.id (which most Kafka clients allow to be optionally configured), it is in no way unique and can’t be used, despite its name, to identify a single client instance.
Other seemingly unique identifiers such as authentication principals or client IP source address and port are either not guaranteed to be unique (there may not be authentication involved or not specific to a single client instance), or not a singleton (a client will have multiple connections to the cluster, each connection with its own unique address+port combination).
Since this KIP intends to have metrics enabled by default in supporting clients, we can’t rely on the client.id being properly set by the application owner. We have to resort to some other mechanism for a client instance to uniquely identify itself. There are ideally two entities that we would like to identify in metrics:
- Client instance - a single instance of a producer, consumer, Admin client, etc.
- Application process instance - a single application runtime, which may contain multiple client instances such as a Kafka Streams application with a mix of Admin, producer and consumer instances.
This proposal suggests that as part of the initial metrics handshake the broker generates a unique client instance id UUID4 and returns it to the client. The client must use the returned client instance id for the remaining lifetime of the client instance, regardless of which broker it communicates with.
The client should provide an API for the application to read the generated client instance id as to assist in mapping and identification of the client based on the collected metrics. As an alternative or complement the client may log its client instance id as soon as it has acquired it from the cluster. This allows live and post-mortem correlation between collected metrics and a client instance.
As it is not feasible for a Kafka client instance to automatically generate or acquire a unique identity for the application process it runs in, and as we can’t rely on the user to configure one, we treat the application instance id as an optional future nice-to-have that may be included as a metrics label if it has been set by the user. This allows a more direct mapping of client instance to application instance and vice versa. However, due to these constraints and the need for zero-configuration on the client, adding an application instance id configuration property is outside the scope of this proposal.
Kafka Streams applications have an application.id configured and this identity should be included as the application_id metrics label.
Mapping
Mapping the client instance id to an actual application instance running on a (virtual) machine can be done by inspecting the metrics resource labels, such as the client source address and source port, or security principal, all of which are added by the receiving broker. This will allow the operator together with the user to identify the actual application instance.
Metrics naming and format
The OpenTelemetry specification will be used as the metrics serialization format as well as to define how metrics are constructed when it comes to naming, metric type, semantics, and so on.
See the OpenTelemetry metrics specification for more information.
Encoding
While future protocol-level requests could allow for other metrics formats, Kafka will only guarantee to support OpenTelemetry. It is required for a client that claims support of this KIP to use the OpenTelemetry v0.19 protobuf format.
Metric payloads are encoded as OpenTelemetry MetricsData v1 protobuf objects.
Naming
This KIP introduces a new naming scheme for Kafka client metrics called telemetry metric names. Client metric subscriptions are defined in terms of telemetry metric names. Telemetry metric names follow the OpenTelemetry conventions for metric naming. Every existing Kafka client metric's name can be transformed into an equivalent telemetry metric name.
This proposal does not define any new client metrics, it just introduces a new scheme for naming them. The telemetry metric name format is being introduced to give a hierarchical naming convention that meets OpenTelemetry rules, enabling interoperability with that ecosystem.
The existing Kafka client metric names consist of two parts: a group name and a metric name. The telemetry metric name is derived by concatenation of:
- The prefix
"messaging.kafka." - The group name with
"-metrics"removed, and every '-' replaced with '.' - The metric name with every '-' replaced with '.'
The following examples illustrate the derivation of the telemetry metric names from Kafka metric names:
| Kafka metric name | Telemetry metric name |
|---|---|
| "connection-creation-rate", group="producer-metrics" |
|
| "rebalance-latency-max", group="consumer-coordinator-metrics" |
|
Other vendor or implementation-specific metrics can be added according to the following examples, using "contrib" followed by an implementation-specific name as the namespace:
| Implementation-specific metric name | Telemetry metric name |
|---|---|
Client "io.confluent.librdkafka" Metric name "client.produce.xmitq.latency" |
|
Python client "com.example.client.python" Metric name "object.count" |
|
Metrics may also hold any number of attributes which provide the multi-dimensionality of metrics. These are similarly derived from the tags of the Kafka metrics, and thus the properties of the equivalent JMX MBeans, replacing '-' with '_'. For example:
| Kafka metric name | Telemetry metric name |
|---|---|
| "request-latency-avg", group="producer-node-metrics", client-id={client-id}, node-id={node-id} |
Attribute keys: |
Sparse metrics
To keep metrics volume down, it is recommended that a client only sends metrics with a recorded value.
Metric aggregation temporality
Metrics are to be sent as either DELTA or CUMULATIVE values, depending on the value of DeltaTemporality in the GetTelemetrySubscriptionsResponse.
CUMULATIVE metrics allow for missed/dropped transmits without loss of precision at the cost of increased processing and complexity required in upstream systems.
While clients must support both temporalities, the broker will initially only send GetTelemetrySubscriptionsResponse.DeltaTemporality=True. Configuration properties or extensions to the Metrics plugin interface on the broker to change the temporality is outside the scope of this KIP and may be addressed at a later time as the need arises.
See OTLP specification for more information on temporality.
Serialized size
As an example, the serialized size prior to compression of all producer and standard metrics defined in this KIP for a producer producing to 50 partitions gives approximately 100 kB.
Compression
As metric names and labels are highly repetitive, it is recommended that the serialized metrics are compressed prior to sending them to the broker if the serialized uncompressed size exceeds 1000 bytes.
The broker will return a prioritized list of supported compression types in the GetTelemetrySubscriptionsResponse.AcceptedCompressionTypes array, the client is free to pick any supported compression type but should pick the first mutually supported type in the returned list. If the AcceptedCompressionTypes array is empty the client must send metrics uncompressed. The default compression types list as returned from the broker should be: ZStd, LZ4, GZip, Snappy.
The PushTelemetryRequest.CompressionType must then be set to the corresponding compression type value as defined for MessageV2.
Preliminary tests indicate that a compression ratio up to 10x is possible for the standard metrics using ZStd.
Decompression of the metrics data will be performed by the broker prior to passing the data to the metrics plugin.
Client metrics and metric labels
This KIP defines two kinds of metrics: standard metrics and required metrics.
A standard metric is a Kafka client metric which clients that support this KIP should support. The standard metrics are a subset of the Kafka client metrics, selected because they measure concepts which are likely to apply well to any client which implements the Kafka protocol. The Apache Kafka client does by definition support all of the standard metrics. Other client implementations should support standard metrics which conceptually make sense.
A required metric is a Kafka client metric which clients that support this KIP must support. The required metrics are a subset of the standards metrics, selected because they have the highest value for monitoring and troubleshooting client performance and whose concepts apply well to all clients which implement the Kafka protocol. The Apache Kafka client does by definition support all of the required metrics.
Defining standard and required metrics makes the monitoring and troubleshooting of clients from various client types because the operator can combine the same metric from all client types. For example, request latencies for all client types are reported in a consistent way. Care has been taken to make these standard metrics as generic as possible, and they should fit most Kafka client implementations.
There are many more Kafka client metrics beyond the standard and required metrics, some of which are quite specific to the way that the Java client works. Any of these other metrics could conceivably be included in client metrics subscriptions, but there's no expectation that non-Java clients would implement them.
Metric types
The metric types in the following tables correspond to the OpenTelemetry v1 metrics protobuf message types. A short summary:
- Sum - Monotonic total count meter (Counter). Suitable for total number of X counters, e.g., total number of bytes sent.
- Gauge - Non-monotonic current value meter (UpDownCounter). Suitable for current value of Y, e.g., current queue count.
Standard producer metrics
All standard telemetry metric names begin with the prefix "messaging.kafka.". This is omitted from the table for brevity. The required metrics are bold.
Telemetry metric name | Type | Labels | Description | Existing Kafka metric name |
|---|---|---|---|---|
| Gauge | The rate of connections established per second. | “connection-creation-rate”, group=”producer-metrics” | |
| Sum | The total number of connections established. | “connection-creation-total”, group=”producer-metrics” | |
| Gauge | node_id | The average request latency in ms for a node. | “request-latency-avg”, group=”producer-node-metrics” |
| Gauge | node_id | The maximum request latency in ms for a node. | “request-latency-max”, group=”producer-node-metrics” |
| Gauge | The average time in ms a request was throttled by the broker. | “produce-throttle-time-avg”, group=“producer-metrics” | |
| Gauge | The maximum time in ms a request was throttled by the broker. | “produce-throttle-time-max”, group=“producer-metrics” | |
| Gauge | The average time in ms record batches spent in the send buffer. | “record-queue-time-avg”, group=“producer-metrics” | |
| Gauge | The maximum time in ms record batches spent in the send buffer. | “record-queue-time-max”, group=“producer-metrics” |
Standard consumer metrics
All standard telemetry metric names begin with the prefix "messaging.kafka.". This is omitted from the table for brevity. The required metrics are bold.
Telemetry metric name | Type | Labels | Description | Existing metric name |
|---|---|---|---|---|
| Gauge | The rate of connections established per second. | “connection-creation-rate”, group= “consumer-metrics” | |
| Sum | The total number of connections established. | “connection-creation-total”, group=”consumer-metrics” | |
| Gauge | node_id | The average request latency in ms for a node. | “request-latency-avg”, group= “consumer-node-metrics” |
| Gauge | node_id | The maximum request latency in ms for a node. | “request-latency-max”, group=“consumer-node-metrics” |
| Gauge | The average fraction of time the consumer’s poll() is idle as opposed to waiting for the user code to process records. | “poll-idle-ratio-avg”, group=“consumer-metrics” | |
| Gauge | The average time taken for a commit request. | “commit-latency-avg”, group=“consumer-coordinator-metrics” | |
| Gauge | The maximum time taken for a commit request. | “commit-latency-max”, group=“consumer-coordinator-metrics” | |
| Gauge | The number of partitions currently assigned to this consumer. | “assigned-partitions”, group=“consumer-coordinator-metrics” | |
| Gauge | The average time taken for group rebalance. | “rebalance-latency-avg”, group=“consumer-coordinator-metrics” | |
| Gauge | The maximum time taken for a group rebalance. | “rebalance-latency-max”, group=“consumer-coordinator-metrics” | |
| Sum | The total time taken for group rebalances. | “rebalance-latency-total”, group=“consumer-coordinator-metrics” | |
| Gauge | The average time taken for a fetch request. | “fetch-latency-avg”, group=“consumer-fetch-manager-metrics” | |
| Gauge | The maximum time taken for a fetch request. | “fetch-latency-max”, group=“consumer-fetch-manager-metrics” |
Standard client resource labels
The following labels should be added by the client as appropriate before metrics are pushed.
Label name | Description |
| application_id | application.id (Kafka Streams only) |
client_rack | client.rack (if configured) |
group_id | group.id (consumer) |
group_instance_id | group.instance.id (consumer) |
group_member_id | Group member id (if any, consumer) |
transactional_id | transactional.id (producer) |
Broker-added labels
The following labels should be added by the broker plugin as metrics are received.
Label name | Description |
client_instance_id | The generated CLIENT_INSTANCE_ID. |
| client_id | client.id as reported in the Kafka protocol header. |
client_software_name | The client’s implementation name as reported in ApiVersionRequest. |
client_software_version | The client’s version as reported in ApiVersionRequest. |
client_source_address | The client connection’s source address. |
client_source_port | The client connection’s source port. |
principal | Client’s security principal. Content depends on authentication method. |
broker_id | Receiving broker’s node-id. |
Client behavior
A client that supports this metric interface and identifies a supporting broker (through detecting at least GetTelemetrySubscriptionsRequestV0 in the ApiVersionResponse) will start off by sending a GetTelemetrySubscriptionsRequest with the ClientInstanceId field set to Null to one randomly selected connected broker to gather its client instance id, the subscribed metrics, the push interval, accepted compression types, etc. This handshake with a Null ClientInstanceId is only performed once for a client instance's lifetime. Sub-sequent GetTelemetrySubscriptionsRequests must include the ClientInstanceId returned in the first response, regardless of broker.
Upon receiving the GetTelemetrySubscriptionsResponse, the client shall update its internal metrics collection to match the received subscription (absolute update) and update its push interval timer according to the returned PushIntervalMs. The first metrics push should be randomized between 0.5 * PushIntervalMs and 1.5 * PushIntervalMs, this is to ensure that not all clients start pushing metrics at the same time after a cluster comes back up after some downtime.
If GetTelemetrySubscriptionsResponse.RequestedMetrics indicates that no metrics are desired (RequestedMetrics is Null), the client should send a new GetTelemetrySubscriptionsResponse after the PushIntervalMs has expired.
If GetTelemetrySubscriptionsResponse.RequestedMetrics is non-empty but does not match any metrics the client provides then the client should PushTelemetryRequests at the indicated PushIntervalMs interval with an empty metrics blob. This is needed so that a broker side metrics plugin can differentiate between non-responsive or buggy clients and clients that don't have metrics matching the subscription set.
Threading
The client will re-use the existing threads that are used for network communication. The existing logic in the poll method of the NetworkClient class issues internal network requests for metadata when needed. The NetworkClient class has been augmented to now also issue internal network requests for telemetry based on the poll interval in the subscription.
The threads that invoke the NetworkClient's poll method are:
KafkaAdminClient: the "admin client runnable" threadKafkaAdminClientcreates a dedicated thread to execute theAdminClientRunnableinner class- The
AdminClientRunnable'sprocessRequestsmethod loops, polling for network requests viaNetworkClient'spollmethod
- The
KafkaConsumer: both the "heart beat" and application threadsKafkaConsumercreates aConsumerNetworkClient(which wraps aNetworkClient) for network communicationKafkaConsumeralso creates aConsumerCoordinatorto manage consumer group members- The
ConsumerCoordinatoris provided with a reference to theConsumerNetworkClientinstance from theKafkaConsumer ConsumerCoordinator(via itsAbstractCoordinatorsuperclass) maintains an inner thread class namedHeartbeatThread- The
HeartbeatThread'srunmethod loops and invokes theConsumerNetworkClient'spollmethod
- The
- The
- The
KafkaConsumer'spollmethod, invoked by the caller on an application thread, also invokes theConsumerNetworkClient'spollmethod - Thus when either the heartbeat thread runs or the application thread polls for new records, the internal
NetworkClient'spollmethod is invoked- Synchronization is performed by the
ConsumerNetworkClientto make sure two threads don't access the innerNetworkClientconcurrently
- Synchronization is performed by the
KafkaProducer: the "sender" thread- The
KafkaProducercreates aSenderto run in a dedicated thread to manage produce requests- The
Senderis provided with a reference to theNetworkClientinstance from theKafkaProducer - The
Sender'srunmethod loops, calling a method namedrunOncein each pass- The
runOncemethod polls for network requests viaNetworkClient'spollmethod
- The
- The
- The
Connection selection
The client may send telemetry requests to any broker, but shall prefer using an already available connection rather than creating a new connection to keep the number of cluster connections down.
It should also keep using the same broker connection for telemetry requests until the connection goes down, at which time it may choose to reconnect and continue using the same broker, or switch over to another broker connection. Using a persistent connection for PushTelemetryRequests is important so that metrics throttling can be properly performed by the receiving broker, and also avoids maintaining metrics state for the client instance id on multiple brokers.
Client termination
When a client is being shut down, it should send its final metrics regardless of the PushIntervalMs time, and only if the client has an active metrics subscription.
To avoid the receiving broker’s metrics rate-limiter to discard this out-of-profile push the PushTelemetryRequest.Terminating field must be set to true. A broker must only allow one such consecutive digression and otherwise throttle the client as if To avoid the receiving broker’s metrics rate-limiter to discard this out-of-profile push the PushTelemetryRequest.Terminating field must be set to true. A broker must only allow one such consecutive digression and otherwise throttle the client as if this field was not set.
The metrics should contain the reason for the client termination by including the client.terminating metric with the label “reason” set to a human readable explanation why the client is being shut down, such as “Fatal error: Static consumer fenced by newer instance”, or “Consumer closed by application”.
...
Actions to be taken by the client if the GetTelemetrySubscriptionsResponse.Error ErrorCode or PushTelemetryResponse.ErrorCode is set to a non-zero value.
Error code | Reason | Client action |
InvalidRecord (87) | Broker failed to decode or validate the client’s encoded metrics. | Log a warning to the application and schedule the next GetTelemetrySubscriptionsRequest to 5 minutes. |
| UnknownSubscriptionId (NEW) | Client sent a PushTelemetryRequest with an invalid or outdated SubscriptionId, the configured subscriptions have changed. | Send a GetTelemetrySubscriptionRequest to update the client's subscriptions. |
UnsupportedCompressionType (76) | Client’s compression type is not supported by the broker. | Send a GetTelemetrySubscriptionRequest to get an up-to-date list of the broker's supported compression types (and any subscription changes). |
The 5 and 30 minute retries are to eventually trigger a retry and avoid having to restart clients if the cluster metrics configuration is disabled temporarily, e.g., by operator error, rolling upgrades, etc.
...
How error and warnings are propagated to the application is client and language specific, simply logging the error is sufficient.
Opting out
Client metrics should be enabled by default in the client but a user may disable the metrics functionality by setting the enable.metrics.push property to false.
Although metrics are enabled in a client, the client will only push metrics that have been configured/subscribed in the cluster.
Also see the Privacy chapter below.
Java client dependencies
Java client dependencies
The OpenTelemetry metrics serialization is used as the The OpenTelemetry metrics serialization is used as metrics payload the payload of the telemetry metrics sent to the broker. This will require us to include the Java Bindings for the OpenTelemetry Protocol (OTLP) as a dependency for the Java client.
implementation("io.opentelemetry.proto:opentelemetry-proto:0.1119.0-alpha")
The OTLP Java bindings library is a minimal dependency and itself requires only the Google Protobuf serialization library:
...
The Gradle build process will be updated to shadow the OTLP Java bindings library and its dependencies to avoid in-JVM versioning conflicts.
Receiving broker
...
behavior
We allow clients to send the GetTelemetrySubscriptions and PushTelemetry requests to any connected broker that reports support for both these APIs in its ApiVersionResponse.
If GetTelemetrySubscriptionsRequest.ClientInstanceId is Null the broker will generate a unique id for the client and return it in the response. Sub-sequent Subsequent requests from the client to any broker must have the ClientInstanceId set to this returned value.
The broker should add additional metrics labels to help identify the client instance before forwarding the metrics to an external system. These are labels such as the namespace, cluster id, client principal, client source address and port, etc. As the metrics plugin may need to add additional metrics on top of this the generic metrics receiver in the broker will not add these labels but rely on the plugins to do so, this avoids deserializing and serializing the received metrics multiple times in the broker.
See Broker-added labels below for the list of labels that should be added by the plugin.
...
Metrics subscriptions are configured through the standard Kafka Admin API configuration interface with the new resource-config resource type CLIENT_METRICS .
The ConfigResource has a name and is of type CLIENT_METRICS, the . The resource - name is any string - it does not have significance to the metrics system other than to group metrics subscriptions in the configuration interface.
The configuration is made up of the following ConfigEntry names:
name- Optional human-readable name of the metric subscription. If one is not provided by the user, the admin client will first auto-generate a type-4 UUID to be used as the name before sending the request to the broker.metrics- a comma-separated list ofmetrics- a comma-separated list of telemetry metric name prefixes, e.g.,"clientmessaging.kafka.producer.node.request.partitionlatency., client.io.wait". Whitespaces aremessaging.kafka.consumer.coordinator.rebalance.latency.max". Whitespace is ignored.interval.ms- metrics push interval in milliseconds. Defaults to 5 minutes if not specified.match_<selector>- Client matching selector that is evaluated as a list of an anchored regexp regular expressions (i.e., "something.*" is treated as "^something.*$"). Any client that matches all of thematch_..selectors will be eligible for this metrics subscription. Initially supported selectors are:client_instance_id- CLIENT_INSTANCE_ID UUID string representation.client_id- client's reported client.id in the GetTelemetrySubscriptionsRequest.client_software_name- client software implementation name.client_software_version- client software implementation version.client_source_address- client connection's source address from the broker's point of view.client_source_port- client connection's source port from the broker's point of view.
Example For example, using the standard kafka-configs.sh tool for create a metrics subscription:
| Code Block | ||
|---|---|---|
| ||
$ kafka-configs.sh --bootstrap-server $BROKERS \ --entity-type client_-metrics \ --entity-name ‘basic"basic_producer_metrics’metrics" \ --alter \ --add-config '"metrics=[org.apachemessaging.kafka/client.producer.partition, messaging.queuekafka., orgconsumer.apachecoordinator.kafka/clientrebalance.iolatency.waitmax],interval.ms=15000,match_=[client_instance_id=b69cc35a-7a54-4790-aa69-cc2bd4ee4538']" |
Or using the dedicated tool (preferred):
...
There is also a new kafka-client-metrics.sh
...
tool which is described later that has easier syntax.
As the assumption is that the number of CLIENT_METRICS configuration entries will be relatively small (<100), all brokers with a configured metrics plugin will monitor and cache the configuration entries for the CLIENT_METRICS resource type.
As a GetTelemetrySubscriptionsRequest is received for a previously unknown client instance id, the CLIENT_METRICS config cache is scanned for any configured metric subscriptions whose match selectors match that of the client. The resulting matching configuration entries are compiled into a list of subscribed metrics which is returned in GetTelemetrySubscriptionsResponse.RequestedMetrics along with the minimum configured collection interval (this can be improved in future versions by including a per-metric interval so that each subscribed metric is collected with its configured interval, but in its current form longer-interval metrics are included “for free” if there are shorter-interval metrics in the subscription set). The CRC32 checksum is also calculated based on the compiled metrics and is returned as the SubscriptionId in the response, as well as stored in the per-client-instance cache on the broker to track configuration changes.
This client instance specific state is maintained in broker memory up to MAX(60*1000, PushIntervalMs * 3) milliseconds and is used to enforce the push interval rate-limiting. There is no persistence of client instance metrics state across broker restarts or between brokers.
Public Interfaces
Kafka Protocol Changes
| Code Block |
|---|
GetTelemetrySubscriptionsRequestV0 {
 	ClientInstanceId uuid    			// UUID4 unique for this client instance.
										// Must be set to Null on the first request, and to the
										// returned ClientInstanceId from the first response
										// for all subsequent requests to any broker.
}

GetTelemetrySubscriptionsResponseV0 {
 	ThrottleTime int32					// Standard throttling
	ErrorCode int16						// Error code
    ClientInstanceId uuid               // Assigned client instance id if ClientInstanceId was Null in the request, else Null.
    SubscriptionId int32                // Unique identifier for the current subscription set for this client instance.
    AcceptedCompressionTypes Array[int8] // The compression types the broker accepts for PushTelemetryRequest.CompressionType
                                        // as listed in MessageHeaderV2.Attributes.CompressionType. The array will be sorted in
                                        // preference order from higher to lower. The CompressionType of NONE will not be
                                        // present in the response from the broker, though the broker does support uncompressed
                                        // client telemetry if none of the accepted compression codecs are supported by the client.
    PushIntervalMs int32				// Configured push interval, which is the lowest configured interval in the current subscription set.
    DeltaTemporality bool               // If True; monotonic/counter metrics are to be emitted as deltas to the previous sample.
                                        // If False; monotonic/counter metrics are to be emitted as cumulative absolute values.
	RequestedMetrics Array[string]		// Requested telemetry metrics prefix string match.
										// Empty array: No metrics subscribed.
										// Array[0] empty string: All metrics subscribed.
										// Array[..]: prefix string match
}

PushTelemetryRequestV0 {
	ClientInstanceId uuid    			// UUID4 unique for this client instance, as retrieved in the first GetTelemetrySubscriptionsRequest.
    SubscriptionId int32                // SubscriptionId from the GetTelemetrySubscriptionsResponse for the collected metrics.
	Terminating bool					// Client is terminating.
    CompressionType int8                // Compression codec used for .Metrics (ZSTD, LZ4, Snappy, GZIP, None).
                                        // Same values as that of the current MessageHeaderV2.Attributes.
	Metrics binary						// Metrics encoded in OpenTelemetry MetricsData v1 protobuf format.
}

PushTelemetryResponseV0 {
	ThrottleTime int32					// Standard throttling
	ErrorCode int16						// Error code
}
|
Metrics serialization format
The metrics format for PushTelemetryRequestV0 is OpenTelemetry Protobuf protocol definitions version 0.19.
Future versions of PushTelemetryRequest and GetTelemetrySubscriptionsRequest may include a content-type field to allow for updated OTLP format versions (or additional formats), but this field is currently not included since only one format is specified by this proposal.
SubscriptionId
The SubscriptionId is a unique identifier for a client instance's subscription set, the id is generated by calculating a CRC32 of the configured metrics subscriptions matching the given client including the PushIntervalMs, XORed with the ClientInstanceId. This SubscriptionId is returned to the client in the GetTelemetrySubscriptionsResponse and the client passes that SubscriptionId in each subsequent PushTelemetryRequest for those received metrics. If the configured subscriptions are updated and resulting in a change for a client instance, the SubscriptionId is recalculated. Upon the next PushTelemetryRequest using the previous SubscriptionId, the broker will find that the received and expected SubscriptionIds differ and it will return UnknownSubscriptionId back to the client. When a client receives this error code it will immediately send a GetTelemetrySubscriptionsRequest to retrieve the new subscription set along with a new SubscriptionId.
This mechanism provides a way for the broker to propagate an updated subscription set to the client and is similar to the use of epochs in other parts of the protocol, but simplified in that no state needs to be persisted; the configured subscription set + client instance id is the identifier itself.
Client telemetry receiver
The broker will expose a plugin interface for client telemetry to be forwarded to or collected by external systems. In particular, since we already collect data in OpenTelemetry format, one goal is to make it possible for a plugin to forward metrics directly to an OpenTelemetry collector.
The existing MetricsReporter plugin interface was built for plugins to pull metrics from the broker, but does not lend itself to the model where the broker pushes metric samples to plugins.
In order to minimize the complexity of additional configuration mechanisms, we are proposing to reuse the existing metrics reporter configuration mechanisms, but allow plugins to implement a new interface (trait) to indicate if they support receiving client telemetry.
This also allows a plugin to reuse the existing labels passed through the MetricsContext (e.g. broker, cluster id, and configured labels) and add them to the OpenTelemetry resource labels as needed.
| Code Block |
|---|
/**
 * A {@link MetricsReporter} may implement this interface to indicate support for collecting client telemetry on the server side
 */
@InterfaceStability.Evolving
public interface ClientTelemetry {

    /**
     * Called by the broker to create a ClientTelemetryReceiver instance.
     * This instance may be cached by the broker.
     *
     * This method will always be called after the initial call to
     * {@link MetricsReporter#contextChange(MetricsContext)}
     * on the MetricsReporter implementing this interface.
     *
     * @return
     */
    ClientTelemetryReceiver clientReceiver();
}

@InterfaceStability.Evolving
public interface ClientTelemetryReceiver {
    /**
     * Called by the broker when a client reports telemetry. The associated request context can be used
     * by the plugin to retrieve additional client information such as client ids or endpoints.
     *
     * This method may be called from the request handling thread, and as such should avoid blocking.
     *
     * @param context the client request context for the corresponding PushTelemetryRequest api call
     * @param payload the encoded telemetry payload as sent by the client
     */
    void exportMetrics(AuthorizableRequestContext context, ClientTelemetryPayload payload);
}

@InterfaceStability.Evolving
public interface ClientTelemetryPayload {

    /**
     * Client's instance id.
     */
    Uuid clientInstanceId();

    /**
     * Indicates whether the client is terminating and sending its last metrics push.
     */
    boolean isTerminating();

    /**
     * Metrics data content-type / serialization format.
     * Currently "application/x-protobuf;type=otlp+metrics0.19"
     */
    String contentType();

    /**
     * Serialized uncompressed metrics data.
     */
    ByteBuffer data();
} |
Admin API
Add a new value CLIENT_METRICS to the enum org.apache.kafka.common.config.ConfigResource.Type . This enables client metrics subscription configuration to be administered using the Kafka admin client as well as the kafka-configs.sh tool.
Client API
Retrieve broker-generated client instance id, may be used by application to assist in mapping the client instance id to the application instance through log messages or other means.
The following method is added to the Producer, Consumer, and Admin client interfaces:
| Code Block |
|---|
/**
 * @returns the client's assigned instance id used for metrics collection.
 */
public String clientInstanceId(Duration timeout) |
If the client has not yet requested a client instance id from the broker this call will block up to the timeout. If no client instance id can be retrieved within the timeout, an error is returned (such as timeout, feature not supported by broker, auth failure).
Client configuration
This applies to producers, consumers, admin client, and of course embedded uses of these clients in frameworks such as Kafka Connect.
| Configuration | Description | Values |
|---|---|---|
enable.metrics.push | Whether to enable pushing of client metrics to the cluster, if the cluster has a client metrics subscription which matches this client. |
|
Client metrics configuration
These are the configurations for client metrics resources. A client metrics subscription is defined by the configurations for a resource of type CLIENT_METRICS .
| Configuration | Description | Values |
|---|---|---|
metrics | A list of telemetry metric name prefixes which specify the metrics of interest. | An empty list means no metrics subscribed. A list containing just an empty string means all metrics subscribed. Otherwise, the list entries are prefix-matched against the metric names. |
interval.ms | The client metrics push interval in milliseconds. | Default: 30000 (5 minutes) |
match | The match criteria for selecting which clients the subscription matches. If a client matches all of these criteria, the client matches the subscription. | A list of key-value pairs. The valid keys are:
The values are anchored regular expressions. |
New error codes
UnknownSubscriptionId - Client sent a PushTelemetryRequest with an invalid or outdated SubscriptionId. The configured subscriptions have changed.
Metrics
The following new broker metrics should be added:
Metric Name | Type | Group | Tags | Description |
|---|---|---|---|---|
ClientMetricsInstanceCount | Gauge | ClientMetrics | version: broker's software version | Current number of client metric instances being managed by the broker. E.g., the number of unique CLIENT_INSTANCE_IDs with an empty or non-empty subscription set. |
ClientMetricsSubscriptionRequestCount | Meter | ClientMetrics | version: broker's software version | Total number of GetTelemetrySubscriptionsRequests received by this broker. |
ClientMetricsUnknownSubscriptionRequestCount | Meter | ClientMetrics | client version: client's software version | Total number of metrics requests GetTelemetrySubscriptionsRequests with unknown CLIENT_INSTANCE_IDs. |
ClientMetricsThrottleCount | Meter | ClientMetrics | client_instance_id | Total number of throttled PushTelemetryRequests due to a higher PushTelemetryRequest rate than the allowed PushIntervalMs. |
ClientMetricsPluginExportCount | Meter | ClientMetrics | client_instance_id | The total number of metrics requests being pushed to metrics plugins, e.g., the number of exportMetrics() calls. |
ClientMetricsPluginErrorCount | Meter | ClientMetrics | client_instance_id | The total number of exceptions raised from plugin's exportMetrics(). |
| ClientMetricsPluginExportTime | Histogram | ClientMetrics | client_instance_id | Amount of time broker spends in invoking plugin exportMetrics call |
Security
Since client metric subscriptions are primarily aimed at the infrastructure operator that is managing the Kafka cluster it should be sufficient to limit the config control operations to the CLUSTER resource.
There will be no permission checks on the PushTelemetryRequest itself.
API Request | Resource | ACL |
|---|---|---|
DescribeConfigs | CLUSTER | DESCRIBE, READ |
AlterConfigs | CLUSTER | WRITE |
| GetTelemetrySubscriptions | N/A | N/A |
PushTelemetry | N/A | N/A |
Tools
kafka-configs.sh
The kafka-configs.sh tool can be used to administer client metrics subscriptions. The kafka-client-metrics.sh tool is preferred because it is more useable.
A new entity-type of client-metrics is added.
For this entity type, the allowed configs are: interval.ms , metrics and match .
Some examples of use of kafka-configs.sh are shown in the next section for comparison with kafka-client-metrics.sh .
kafka-client-metrics.sh
A new kafka-client-metrics.sh tool is added which provides a simpler interface for administering client metrics subscriptions than using kafka-configs.sh directly.
Here's the command-line syntax summary.
| Code Block |
|---|
This tool helps to manipulate and describe client metrics subscriptions
Option                                 Description
------                                 -----------
--alter                                Alter the configuration of the client
                                         metrics subscription.
--block                                Block metrics collection.
--bootstrap-server <String: server to  The Kafka server to connect to. This
  connect to>                            is required for describing and
                                         altering broker configs.
--command-config <String: command      Property file containing configs to be
  config property file>                  passed to Admin Client. This is used
                                         only with --bootstrap-server option
                                         for describing and altering broker
                                         configs.
--delete                               Delete the configuration of the client
                                         metrics subscription.
--describe                             List configs for the client metrics subscriptions.
--generate-name                        Generate a UUID to use as the name.
--interval                             The metrics push interval in milliseconds.
--match                                Matching selector ‘k1=v1,k2=v2’. The following
                                         is a list of valid selector names:
                                         client_instance_id
                                         client_id
                                         client_software_name
                                         client_software_version
                                         client_source_address
                                         client_source_port
--metrics                              Telemetry metric name prefixes ‘m1,m2’.
--name <String>                        Name of client metrics subscription.
--help                                 Print usage information.
--version Display Kafka version. |
Here are some examples.
List all client metrics subscriptions
| Code Block | ||
|---|---|---|
| ||
$ kafka-client-metrics.sh --bootstrap-server $BROKERS --describe

$ kafka-configs.sh --bootstrap-server $BROKERS --describe --entity-type client-metrics |
Describe a client metrics subscription
| Code Block |
|---|
$ kafka-client-metrics.sh --bootstrap-server $BROKERS --describe --name METRICSUB

$ kafka-configs.sh --bootstrap-server $BROKERS --describe --entity-type client-metrics --entity-name METRICSUB |
Create a client metrics subscription, generating a unique name
In this example, --generate-name causes the tool to create a type-4 UUID to use as the client metrics subscription name. There is no equivalent in kafka-configs.sh .
| Code Block |
|---|
$ kafka-client-metrics.sh --bootstrap-server $BROKERS --alter --generate-name \
  --metrics messaging.kafka.producer.node.request.latency.,messaging.kafka.consumer.node.request.latency. \
--interval 60000 |
Create a client metrics subscription for all Python v1.2.* clients
| Code Block |
|---|
$ kafka-client-metrics.sh --bootstrap-server $BROKERS --alter --name METRICSUB \
  --metrics messaging.kafka.consumer. \
  --interval 60000 \
  --match "client_software_name=kafka_python,client_software_version=1\.2\..*"

$ kafka-configs.sh --bootstrap-server $BROKERS --alter --entity-type client-metrics --entity-name METRICSUB \
--add-config "metrics=messaging.kafka.consumer.,interval.ms=60000,match=[client_software_name=kafka.python,client_software_version=1\.2\..*]" |
Block an existing client metrics subscription from pushing metrics
Blocking pushing metrics for a client metrics subscription is achieved by setting the push interval to 0ms.
| Code Block |
|---|
$ kafka-client-metrics.sh --bootstrap-server $BROKERS --alter --name METRICSUB --block

$ kafka-configs.sh --bootstrap-server $BROKERS --alter --entity-type client-metrics --entity-name METRICSUB \
--add-config "interval.ms=0" |
Delete a client metrics subscription
Deletion of a client metrics subscription with kafka-configs.sh requires listing the names of the configs to delete.
| Code Block |
|---|
$ kafka-client-metrics.sh --bootstrap-server $BROKERS --delete --name METRICSUB

$ kafka-configs.sh --bootstrap-server $BROKERS --alter --entity-type client-metrics --entity-name METRICSUB \
--delete-config metrics,interval.ms,match |
As the assumption is that the number of CLIENT_METRICS configuration entries will be relatively small (<100), all brokers with a configured metrics plugin will monitor and cache the configuration entries for the CLIENT_METRICS resource type.
As a GetTelemetrySubscriptionsRequest is received for a previously unknown client instance id the CLIENT_METRICS config cache is scanned for any configured metric subscriptions whose match selectors match that of the client. The resulting matching configuration entries are compiled into a list of subscribed metrics which is returned in GetTelemetrySubscriptionsResponse.RequestedMetrics along with the minimum configured collection interval (this can be improved in future versions by including a per-metric interval so that each subscribed metric is collected with its configured interval, but in its current form longer-interval metrics are included “for free” if there are shorter-interval metrics in the subscription set). The CRC32 checksum is also calculated based on the compiled metrics and is returned as the SubscriptionId in the response, as well as stored in the per-client-instance cache on the broker to track configuration changes.
This client instance specific state is maintained in broker memory up to MAX(60*1000, PushIntervalMs * 3) milliseconds and is used to enforce the push interval rate-limiting. There is no persistence of client instance metrics state across broker restarts or between brokers.
New broker metrics
The following new broker metrics should be added:
...
Metric Name
...
Type
...
Tags
...
Description
...
ClientMetricsInstanceCount
...
Gauge
...
version: broker's software version
...
Current number of client metric instances being managed by the broker. E.g., the number of unique CLIENT_INSTANCE_IDs with an empty or non-empty subscription set.
...
ClientMetricsSubscriptionRequestCount
...
Meter
...
version: broker's software version
...
Total number of GetTelemetrySubscriptionsRequests received by this broker.
...
ClientMetricsUnknownSubscriptionRequestCount
...
Meter
...
client version: client's software version
...
Total number of metrics requests GetTelemetrySubscriptionsRequests with unknown CLIENT_INSTANCE_IDs.
...
ClientMetricsThrottleCount
...
Meter
...
client_instance_id
...
Total number of throttled PushTelemetryRequests due to a higher PushTelemetryRequest rate than the allowed PushIntervalMs.
...
ClientMetricsPluginExportCount
...
Meter
...
client_instance_id
...
The total number of metrics requests being pushed to metrics plugins, e.g., the number of exportMetrics() calls.
...
ClientMetricsPluginErrorCount
...
Meter
...
client_instance_id
reason (reason for the failure)
...
The total number of exceptions raised from plugin's exportMetrics().
...
Client metrics and metric labels
Defining a standard metrics set makes monitoring and troubleshooting easier, as the operator can combine the same metric from multiple client types in the same graph, e.g., request latencies, and it also makes setting up metrics subscriptions easier. Care has been taken to make these standard metrics as generic as possible, and should fit most Kafka client implementations. We try to avoid metrics that are available or derivable from existing broker metrics.
All standard metrics are prefixed with the “org.apache.kafka.” namespace , this prefix is omitted from the following tables for brevity.
Clients that support this KIP should provide at least a subset of the following standard metrics, given that the metrics are relevant to that client implementation.
Client implementations may also provide additional metrics that are specific to that implementation, these custom metrics must reside in their own namespace by prefixing the metric name with their own namespace. The official Apache Kafka Java clients resides in the official org.apache.kafka namespace.
Private metrics
The default metrics collection on the client must take extra care not to expose any information about the application and system it runs on as they may identify internal projects, infrastructure, etc, that the user may not want to expose to the Kafka infrastructure owner. This includes information such as hostname, operating system, credentials, runtime environment, etc. None of the metrics defined in this proposal expose any such information.
OpenTelemetry specifies a range of relevant metrics:
Private or host metrics are outside the scope of this specification.
Metric types
The metric types in the following tables correspond to the OpenTelemetry v1 metrics protobuf message types. A short summary:
- Sum - Monotonic total count meter (Counter). Suitable for total number of X counters, e.g., total number of bytes sent.
- Gauge - Non-monotonic current value meter (UpDownCounter). Suitable for current value of Y, e.g., current queue count.
- Histogram - Value distribution meter (ValueRecorder). Suitable for latency values, etc.
For simplicy a client implementation may choose to provide an average value as Gauge instead of a Histogram. These averages should be using the original Histogram metric name + ".avg", e.g., "client.request.rtt.avg".
Client instance-level metrics
...
Metric name
...
Type
...
Labels
...
Description
...
client.connection.creations
...
Sum
...
broker_id
...
Total number of broker connections made.
...
client.connection.active
...
Gauge
...
Current number of broker connections.
...
client.connection.errors
...
Sum
...
reason
...
Total number of broker connection failures. Label ‘reason’ indicates the reason:
disconnect - remote peer closed the connection.
auth - authentication failure.
TLS - TLS failure.
timeout - client request timeout.
close - client closed the connection.
...
client.request.rtt
...
Histogram
...
broker_id
request_type
...
Average request latency / round-trip-time to broker and back.
request_type is the protocol request type CamelCase name as specified in the Kafka protocol definition.
...
client.request.queue.latency
...
Histogram
...
broker_id
...
Average request queue latency waiting for request to be sent to broker.
...
client.request.queue.count
...
Gauge
...
broker_id
...
Number of requests in queue waiting to be sent to broker.
...
client.request.success
...
Sum
...
broker_id
request_type
...
Number of successful requests to broker, that is where a response is received without no request-level error (but there may be per-sub-resource errors, e.g., errors for certain partitions within an OffsetCommitResponse).
...
client.request.errors
...
Sum
...
broker_id
request_type
reason
...
Number of failed requests.
Label ‘reason’ indicates the reason:
timeout - client timed out the request,
disconnect - broker connection was closed before response could be received,
error - request-level protocol error.
...
client.io.wait.time
...
Histogram
...
Amount of time waiting for socket I/O writability (POLLOUT). A high number indicates socket send buffer congestion.
...
Client instance-level Producer metrics
...
Metric name
...
Type
...
Labels
...
Description
...
client.producer.record.queue.bytes
...
Gauge
...
Current amount of memory used in producer record queues.
...
client.producer.record.queue.max.bytes
...
Gauge
...
Total amount of queue/buffer memory allowed on the producer queue(s).
...
client.producer.record.queue.count
...
Gauge
...
Current number of records on the producer queue(s).
...
client.producer.record.queue.max.count
...
Gauge
...
Maximum amount of records allowed on the producer queue(s).
Client instance-level Consumer metrics
...
Metric name
...
Type
...
Labels
...
Description
...
client.consumer.poll.interval
...
Histogram
...
The interval at which the application calls poll(), in seconds.
...
client.consumer.poll.last
...
Gauge
...
The number of seconds since the last poll() invocation.
...
client.consumer.poll.latency
...
Histogram
...
The time it takes poll() to return a new message to the application
...
client.consumer.commit.count
...
Sum
...
Number of commit requests sent.
...
client.consumer.group.assignment.partition.count
...
Gauge
...
Number of currently assigned partitions to this consumer by the group leader.
...
client.consumer.assignment.partition.count
...
Gauge
...
Number of currently assigned partitions to this consumer, either through the group protocol or through assign().
...
client.consumer.group.rebalance.count
...
Sum
...
Number of group rebalances.
...
client.consumer.record.queue.count
...
Gauge
...
Number of records in consumer pre-fetch queue.
...
client.consumer.record.queue.bytes
...
Gauge
...
Amount of record memory in consumer pre-fetch queue. This may also include per-record overhead.
...
client.consumer.record.application.count
...
Sum
...
Number of records consumed by application.
...
client.consumer.record.application.bytes
...
Sum
...
Memory of records consumed by application.
Client topic-level Producer metrics
...
Metric name
...
Type
...
Labels
...
Description
...
client.producer.partition.record.queue.bytes
...
Gauge
...
topic
partition
...
Number of bytes queued on partition queue.
...
client.producer.partition.record.queue.count
...
Gauge
...
topic
partition
...
Number of records queued on partition queue.
...
client.producer.partition.record.latency
...
Histogram
...
topic
partition
...
Total produce record latency, from application calling send()/produce() to ack received from broker.
...
client.producer.partition.record.queue.latency
...
Histogram
...
topic
partition
...
Time between send()/produce() and record being sent to broker.
...
client.producer.partition.record.retries
...
Sum
...
topic
partition
...
Number of ProduceRequest retries.
...
client.producer.partition.record.failures
...
Sum
...
topic
partition
reason
...
Number of records that permanently failed delivery. Reason is a short string representation of the reason, which is typically the name of a Kafka protocol error code, e.g., “RequestTimedOut”.
...
client.producer.partition.record.success
...
Sum
...
topic
partition
...
Number of records that have been successfully produced.
...
Host process metrics (optional)
These metrics provide runtime information about the operating system process the client runs in.
...
Metric name
...
Type
...
Labels
...
Description
...
client.process.memory.bytes
...
Gauge
...
Current process/runtime memory usage (RSS, not virtual).
...
client.process.cpu.user.time
...
Sum
...
User CPU time used (seconds).
...
client.process.cpu.system.time
...
Sum
...
System CPU time used (seconds).
...
client.process.pid
...
Gauge
...
The process id. Can be used, in conjunction with the client host name to map multiple client instances to the same process.
Standard client resource labels
...
Label name
...
Description
...
client_rack
...
client.rack (if configured)
...
group_id
...
group.id (consumer)
...
group_instance_id
...
group.instance.id (consumer)
...
group_member_id
...
Group member id (if any, consumer)
...
transactional_id
...
transactional.id (producer)
Broker-added labels
The following labels should be added by the broker plugin as metrics are received
...
Label name
...
Description
...
client_instance_id
...
client_software_name
...
The client’s implementation name as reported in ApiVersionRequest.
...
client_software_version
...
client_source_address
...
The client connection’s source address.
...
client_source_port
...
The client connection’s source port.
...
principal
...
Client’s security principal. Content depends on authentication method.
...
broker_id
...
Receiving broker’s node-id.
Security
Since client metric subscriptions are primarily aimed at the infrastructure operator that is managing the Kafka cluster it should be sufficient to limit the config control operations to the CLUSTER resource.
There will be no permission checks on the PushTelemetryRequest itself.
...
API Request
...
Resource
...
ACL
...
DescribeConfigs
...
CLUSTER
...
DESCRIBE,READ
...
AlterConfigs
...
CLUSTER
...
WRITE
...
PushTelemetryRequest
...
N/A
...
N/A
See the Private metrics chapter above for privacy/integrity.
Tools
kafka-client-metrics.sh is a wrapper tool around kafka-configs.sh that makes it easier to set up metric subscriptions.
...
bin/kafka-client-metrics.sh [arguments] --bootstrap-server <brokers>

List configured metrics:
	--list
    [ --name <descriptive-config-name> ]

Add metrics:
	--add
    [ --name <descriptive-config-name> ]
	--metric <metric-prefix>..   # may repeat
	--interval-ms <interval>
    --match <selector=regex>  # optional, may repeat
    [ --block ]  # Disables all metrics subscriptions for matching client instances.

Delete metrics:
	--delete
    --name <descriptive-config-name>
...
Example workflows
Example workflows showcasing how this feature may be used for proactive and reactive purposes.
...
The monitoring system detects an anomaly for CLIENT_INSTANCE_ID=4e6fb54c-b8e6-4517-889b-e15b99c09c20’s metric org.apache.kafka.client.producer.partition.queue.latency e15b99c09c20 which for more than 180 seconds has exceeded the threshold of 5000 milliseconds.
Before sending the alert to the incident management system, the monitoring system collects a set of labels that are associated with this CLIENT_INSTANCE_ID, such as:
- client.id
- client_source_address and client_source_port on broker id X (1 or more such mappings based on how many connections the client has used to push metrics).
- principal
- tenant
- client_software_name and client_software_version
- In case of consumer: group_id, group_instance_id (if configured) and the latest known group_member_id.
- In case of transactional producer: transactional_id
This collection of information, along with the triggered metric, is sent to the incident management system for further investigation or aggregation, and provides enough information to identify who which client and where the client is run. Further action might be to contact the organization or team that matches the principal, transactional.id, source address , etc, and so on for further investigation.
...
The application owner reports a lagging consumer that is not able to keep up with the incoming message rate and asks for the Kafka operator to help troubleshoot. The application owner, who unfortunately does not know the client instance id of the consumer, provides the client.id, userid, and source address.
The Kafka operator adds a metrics subscription for metrics matching prefix “org"messaging.apache.kafka.client.consumer.” " and with the client_source_address and client_id as matching selector. Since this is a live troubleshooting case, the metrics push interval is set to a low 10 seconds.
The metrics subscription propagates through configuration change notifications to all brokers which update their local metrics subscription config cache and regenerates the SubscriptionId.
Upon the next intervalled PushTelemetryRequest or GetTelemetrySubscriptionsRequest from the clients matching the given source address and client_id, the receiving broker sees that the SubscriptionId no longer matches its metrics subscription cache, the client retrieves the new metrics subscription and schedules its next metrics push to a random value between PushIntervalMs * 0.5 .. PushIntervalMs * 1.5.
...
Tracing and logging are outside the scope of this proposal but the use of OpenTelemetry allows for those additional two methods within the same semantics and nomenclature outlined by this proposal.
When we add new client metrics to Kafka, we can choose whether to make them standard or required metrics in order to enhance the ability to analyze and troubleshoot client performance.
We could also add proper support for histogram metrics in the client, and this would nicely fit with histograms in OpenTelemetry metrics.
Compatibility, Deprecation, and Migration Plan
What impact (if any) will there be on existing users?
Clients
Short of Apart from the configuration property to disable telemetry ( "enable.metrics.push=false - enabled by default) " ) to disable telemetry, there are no user-facing changes to client users.
...
The Kafka admin needs to explicitly configure a Metrics reporter plugin that supports the new push-based telemtry telemetry interface. If no such plugin is configured, the telemetry collection is disabled and there will be no user-facing changesbe no user-facing changes. The default configuration for the Kafka broker does not configure a plugin.
Depending on the metrics subscription patterns and intervals, there is likely to be increased CPU and network load as brokers will receive, decompress and forward pushed client telemetry to the metrics plugin.
If we are changing behavior how will we phase out the older behavior?
No behavioural behavioral changes.
If we need special migration tools, describe them here.
...
Not relevant.
Rejected Alternatives
Create a new set of client telemetry metrics
An earlier version of this KIP introduced a new set of client telemetry metrics, completely independent of the existing Kafka client metrics. This was rejected because it was felt that the lack of correspondence between the metrics available on the client and those sent to the broker to support this KIP was confusing. For example, there were two independent ways of measuring latency which did not match.
Send metrics out-of-band directly to collector or to separate metric cluster
...
An earlier version of this proposal had the notion of metrics coordinator which was selected based on the client instance id. This metrics coordinator would be responsible for rate-limiting pushed metrics per client instance. To avoid each client to have a connection to its metric coordinator, the proposal suggested using the impersonation/request-forwarding functionality suggested in a contemporary design by Jason G.
Since this made the broker-side implementation more complex and did not provide fool-proof foolproof control of misbehaving clients, (a rogue client could simply generate new instance ids on each request) it was decided that the value of this functionality was not in on par with the implementation cost and thus removed from the proposal.
...
The Push interface is well suited for propagating client configuration to clients, but to keep scope down we leave that out of this proposal. It should be straightforward to extend and repurpose augment the interface described in this proposal to also support dynamic client configuration, log/event retrieval , etc, and so on at a later time.
Use native Kafka protocol framing for metrics
The Kafka protocol has flexible fields that would allow us to construct the metrics serialization with pure Kafka protocol fields, but this would duplicate the efforts of the OpenTelemetry specification where Kafka would have to maintain its own specification. On the broker side, the native Kafka protocol metrics would need to be converted to OpenTelemetry (or other) format anyway.
The OpenTelemetry serialization format is all Protobufs and should thus be generally available across all client implementation languages.