DUE TO SPAM, SIGN-UP IS DISABLED. Goto Selfserve wiki signup and request an account.
...
- Unknown User (nagarwal) : [APPROVED/REQUESTED_INFO/REJECTED]
- Vinoth Chandar : [APPROVED/REQUESTED_INFO/REJECTED]...
- Unknown User (pwason) : [APPROVED/REQUESTED_INFO/REJECTED]
Status
Current state:
| Current State | |||||||||
|---|---|---|---|---|---|---|---|---|---|
|  | ||||||||
|
| |||||||||
| |||||||||
|
...
When an executor is performing a task belonging to a specific stage, it will report observability stats in serializable HoodieObservabilityStats structure, which is a container of <metricName, Counter>. In the first iteration of the implementation, our goal is to collect stats around Hoodie write stage, that could manifest as performance differences between executors due to bottlenecks (imbalance in distribution of work, memory related bottlenecks and/or hosts that are slow or having issues).
...
General template/model is for the driver to collect/consolidate HoodieObservabilityStats pertaining to the stagestages, reported by the executors, and create gauges for the collected metrics. (in the metrics layer). When the JVM shutdown hook for Metrics class is invoked, all collected stats for the job will be reported to Graphite (and/or Kafka) metric sinks.
...
During the HoodieBloomIndex stage, the observability stats are returned by the executors on KeyLookupResult, reporting the matching records for each partitionPath/fileId. KeyLookupResult will be extended to include the HoodieObservabilityStats. Observability stats will be collected/consolidated and reported to the Metrics layer at the completion of the stage. Actual reporting of the stats to the Graphite/Kafka sink will happen at the time of JVM shutdown, Metrics shutdown hook is triggered.
Distributed Registry
Spark execution engine offers Spark accumulatorV2, that enables distributed registry functionality, where individual executors can report stats to a registry on the driver, with custom implementations to merge/consolidate the executor level stats before reporting them (to a dashboard, like Graphite or to Kafka). When reporting stats from the executors, executors will try to consolidate the samples before reporting the data, to avoid performance related issues with stats reporting. For example for collecting per record write times, if an executor were to write million records to a file, we would report one set of amortized stats for the write operation (at the spark task level) as opposed to reporting the per record write time samples for every record.
Power of the framework
From a developer’s perspective, let’s say we are suspecting one or more of the executors/containers used for a dataset are slow or having issues. Hudi code running on the executor must perform the following step to report the stats to Graphite/Kafka.
...
On the observability dashboard, by setting up a chart to observe the patterns across the runs (and/or datasets) would highlight the host outliers (wireframe example).
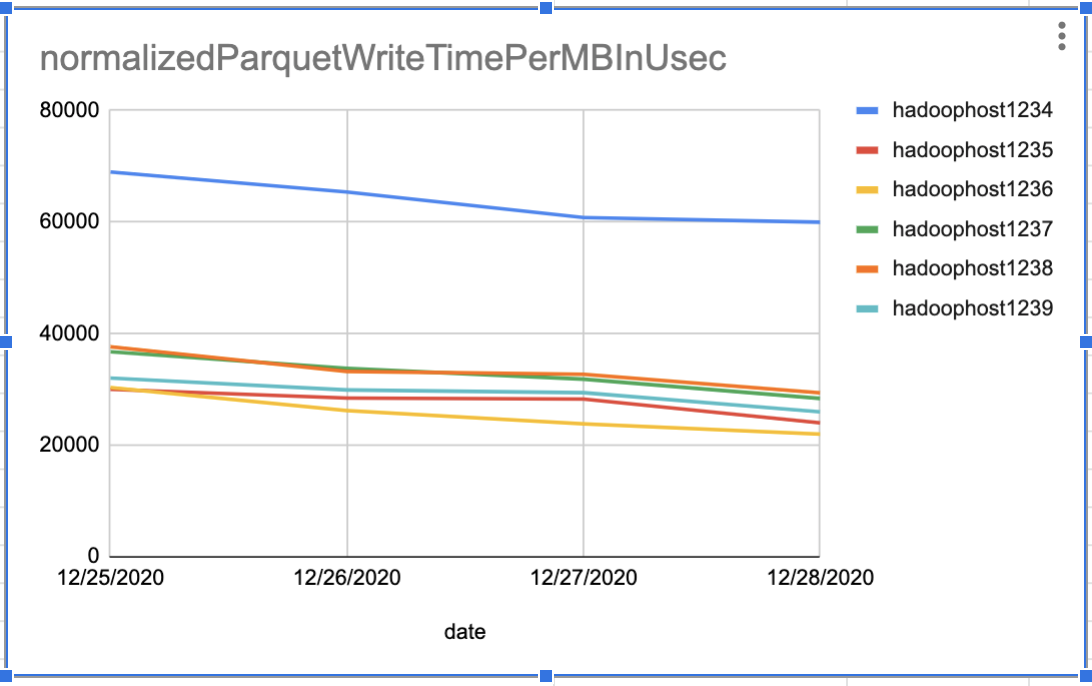
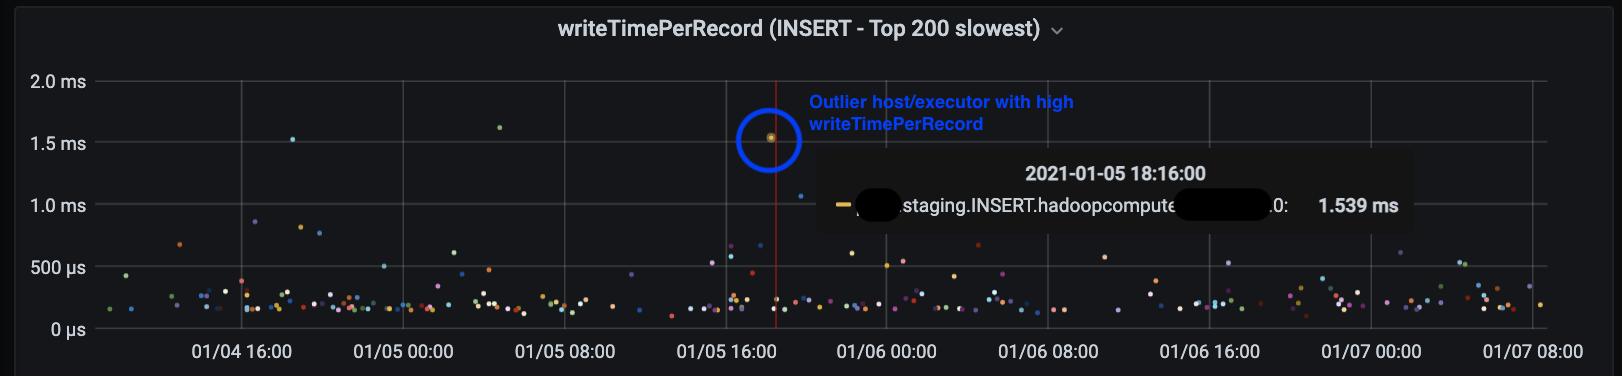
By building a dashboard, with ability to filter on hoodie dataset, ingestion run, host information, stage bottlenecks and host/executor outliers can be identified.

Rollout/Adoption Plan
...