THIS IS A TEST INSTANCE. ALL YOUR CHANGES WILL BE LOST!!!!
...
| Markdown |
|---|
# 设计目的
设计一款对iotdb数据进行可视化和监控的grafana插件。
# 基本功能
用户可以通过grafana界面(通过选择timeseries,是否聚合,聚合条件来组成sql)进行原始和聚合数据的查询。
# 设置插件界面
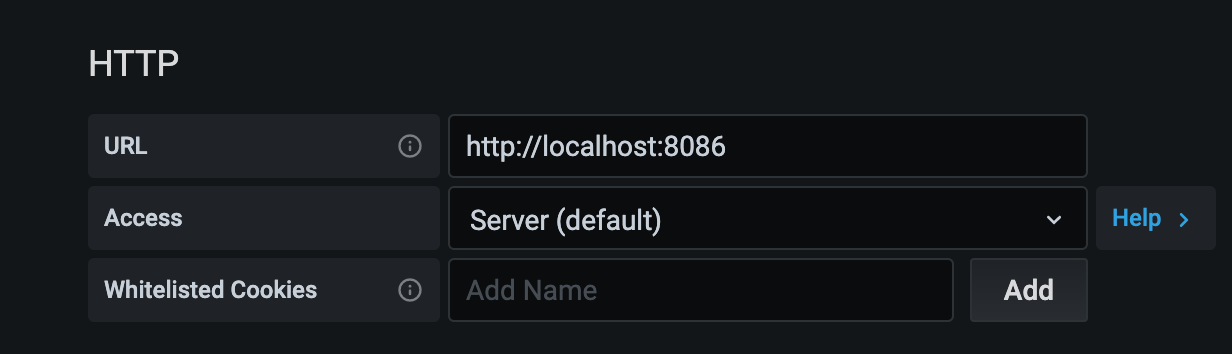
### 1. HTTP设置
* 设置URL,例如`http://localhost:8086`
* 设置访问模式,grafana代理访问和浏览器直接访问。(暂时只支持grafana代理)
* 设置白名单Cookies。一般来说grafana代理会删除所有Cookies,但是在白名单里的不会删除 (未来开发)
##### example
[](https://imgchr.com/i/DmdisH)
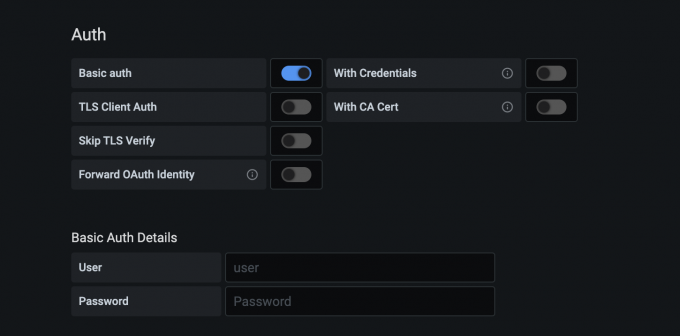
### 2. 安全认证
* 设置用户密码认证
* 其他安全认证在未来开发
##### example
[](https://imgchr.com/i/DmwtHA)
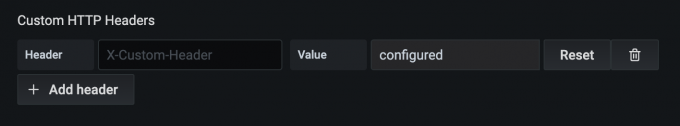
### 3. 用户自定义Http头 (暂时不支持)
##### example
[](https://imgchr.com/i/Dm0k5t)
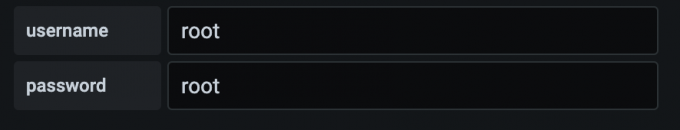
### 4. 登陆设置
* 用户名
* 用户密码
##### example
[](https://imgchr.com/i/DmBmJx)
# 查询界面
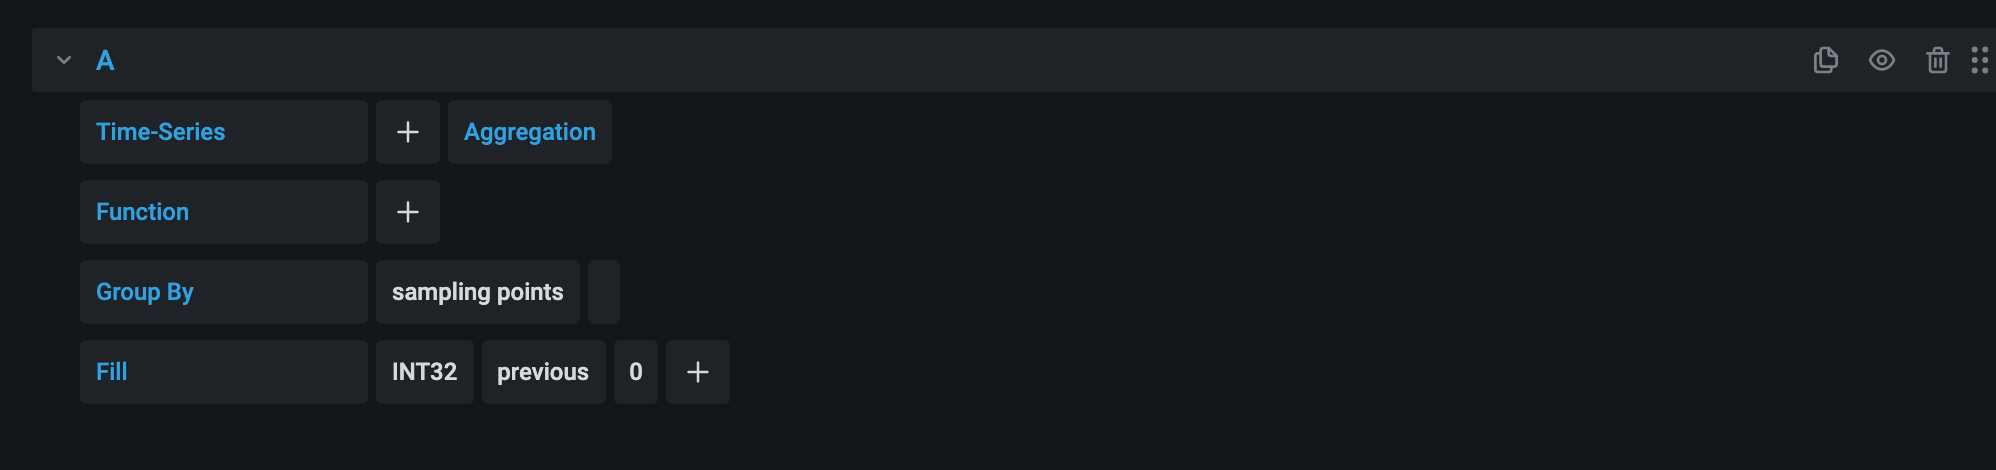
* 选择timeseries,root不需要选,自动会显示出来。然后选择下一个层级,例如[sg1, sg2,sg3],再选择下一个层级,例如[d1,d2,d3]。再选择下一个层级,例如[s1,s2,s3]。直到选择出完整的时间序列。
* 选择聚合还是原始数据查询
* 选择聚合函数
* 选择按时间范围还是按照固定数量对时间段进行等切分,输入滑动步长。
* 输入fill相关部分。
##### example
[](https://imgchr.com/i/DmsNf1)
# 后端所需接口
### 1. 数据查询接口
##### 请求URL
```
POST http://localhost:8282/query
```
##### 数据请求json例子
```json
{
"timeSeries": [
"root.sg1.d1.s1",
"root.sg1.d1.s3", "sg1", "d1", "s1"
],
"from": 1,
"to": 20,
"groupBy": {
"samplingPoints": 19
},
"aggregationsaggregation": [
"COUNT",
"COUNT"
]
}
```
##### 数据返回json例子
```json
[
{
"target":"root.test.m0",
"points":[
[1,2],
[1,3],
[1,4],
[1,5],
[1,6],
[1,7],
[1,8],
[1,9],
[1,10],
[1,11],
[1,12],
[1,13],
[1,14],
[1,15],
[1,16],
[1,17],
[1,18],
[1,19],
[0,20]
]
},
{
"target": "root.test.m9",
"points":[
[1,2],
[1,3],
[1,4],
[1,5],
[1,6],
[1,7],
[1,8],
[1,9],
[1,10],
[1,11],
[1,12],
[1,13],
[1,14],
[1,15],
[1,16],
[1,17],
[1,18],
[1,19],
[0,20]]
}
]
```
### 2. 请求时间序列下一层级目录
##### 请求URL
```
GET http://localhost:8282/childPath?path=root.sg1
```
##### 返回json数据
```json
[d1,d2,d3]
```
# grafana与后端的联系
grafana通过getBackendSrv(底层也就是前端的fetch)去请求后端数据,经过grafana代理。
|