THIS IS A TEST INSTANCE. ALL YOUR CHANGES WILL BE LOST!!!!
...
Specifying Post processing Functions
Similar to aggregate functions, post processing functions can also be specified. Currently, we have 2 post processing functions - rate (Rate per second) and diff (difference between consecutive values). Post processing functions can also be applied after aggregate functions.
Examples
http://<AMS_HOST>:6188/ws/v1/timeline/metrics?metricNames=regionserver.Server.totalRequestCount._rate,regionserver.Server.writeRequestCount._diff&appId=hbase&startTime=14000000&endTime=14200000
http://<AMS_HOST>:6188/ws/v1/timeline/metrics?metricNames=regionserver.Server.readRequestCount._max._diff&appId=hbase&startTime=14000000&endTime=14200000
Specifying Wild Cards
Both metricNames and hostname take wildcard (%) values for a group of metric (or hosts). A query can have a combination of full metric names and names with wildcards also.
Examples
http://<AMS_HOST>:6188/ws/v1/timeline/metrics?metricNames=regionserver.Server.%&appId=hbase&startTime=14000000&endTime=14200000
http://<AMS_HOST>:6188/ws/v1/timeline/metrics?metricNames=regionserver.Server.%&hostname=abc.testdomain124.devlocal&appId=hbase&startTime=14000000&endTime=14200000
http://<AMS_HOST>:6188/ws/v1/timeline/metrics?metricNames=master.AssignmentManger.ritCount,regionserver.Server.%&hostname=abc.testdomain124.devlocal&appId=hbase&startTime=14000000&endTime=14200000
http://<AMS_HOST>:6188/ws/v1/timeline/metrics?metricNames=regionserver.Server.%&hostname=abc.testdomain12%.devlocal&appId=hbase&startTime=14000000&endTime=14200000
Downsampling
As discussed before, AMS downsamples data when higher time ranges are requested. The default "downsampled across time" data returned is AVG. Specific downsamples can be requested by adding the aggregate function qualifiers ( ._avg, ._max, ._min, ._sum ) to the metric names the same way like requesting aggregates across the cluster.
Example
http://<AMS_HOST>:6188/ws/v1/timeline/metrics?metricNames=regionserver.Server.totalRequestCount._max&hostname=abc.testdomain124.devlocal&appId=hbase&startTime=14000000&endTime=14200000&precision=MINUTES
The above query returns 5 minute data for the metric, where the data point value is the MAX of the values found in every 5 minute range.
...
AMS Metadata API
Internal
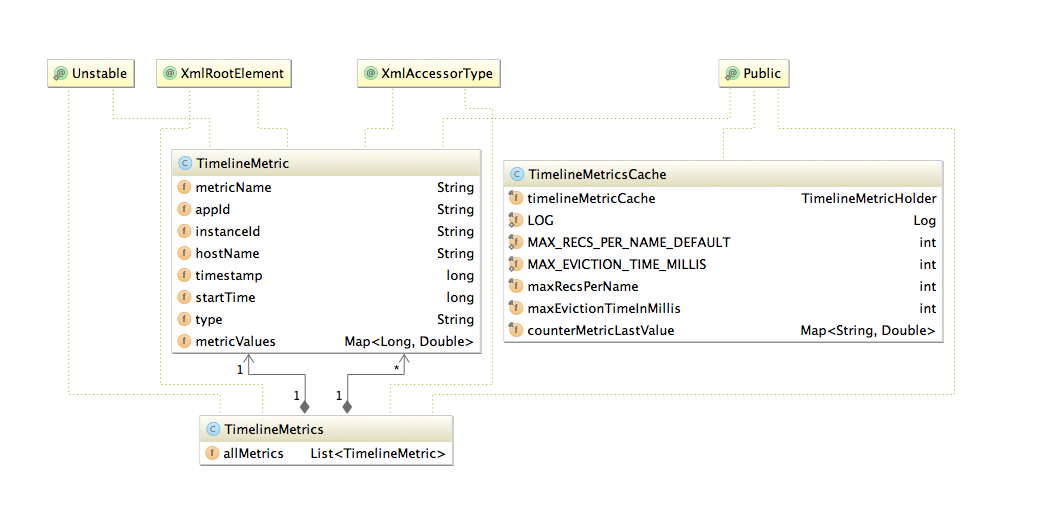
METRIC DATA STRUCTURE
Source location for common data structures module: https://github.com/apache/ambari/tree/trunk/ambari-metrics/ambari-metrics-common/
INTERNAL PHOENIX KEY STRUCTURE
The Metric Record Key data structure is described below:
Property | Type | Comment | Optional |
|---|---|---|---|
Metric Name | String | First key part, important consideration while querying from HFile storage | N |
Hostname | String | Second key part | N |
Server time | Long | Timestamp on server when first metric write request was received | N |
Application Id | String | Uniquely identify service | N |
Instance Id | String | Second key part to identify instance/ component | Y |
Start time | Long | Start of the timeseries data |
HOW AGGREGATION WORKS
- The granularity of aggregate data can be controlled by setting wake up interval for each of the aggregator threads.
- Presently we support 2 types of aggregators, HOST and APPLICATION with 3 time dimensions, per minute, per hour and per day.
- The HOST aggregates are just aggregates on precision data across the supported time dimensions.
- The APP aggregates are
...
- across appId. Note: We ignore instanceId for APP level aggregates. Same time dimensions apply for APP level aggregates.
- We also support HOST level metrics for APP, meaning you can expect a system metric example: "cpu_user"
...
- to be aggregated across datanodes, effectively calculating system metric for hosted apps.
- Each aggregator performs checkpointing by storing last successful time of completion in a file. If the checkpoint is too old, the aggregators will discard checkpoint and aggregate data for the configured interval, meaning data in
...
- between (now - interval)
...
- time.
- Refer
...
...
Internal Data structures
Source location for common data structures module: https://github.com/apache/ambari/tree/trunk/ambari-metrics/ambari-metrics-common/
The Metric Record Key data structure is described below:
Property
Type
Comment
Optional
Metric Name
String
First key part, important consideration while querying from HFile storage
N
Hostname
String
Second key part
N
Server time
Long
Timestamp on server when first metric write request was received
N
Application Id
String
Uniquely identify service
N
Instance Id
String
Second key part to identify instance/ component
Y
Start time
Long
Start of the timeseries data
- for details of tables and records.
...