THIS IS A TEST INSTANCE. ALL YOUR CHANGES WILL BE LOST!!!!
Sending Metrics to AMS (POST)
Sending metrics to Ambari Metrics Service can be achieved through the following API call.
...
Specifying Post processing Functions
Similar to aggregate functions, post processing functions can also be specified. Currently, we have 2 post processing functions - rate (Rate per second) and diff (difference between consecutive values). Post processing functions can also be applied after aggregate functions.
Examples
http://<AMS_HOST>:6188/ws/v1/timeline/metrics?metricNames=regionserver.Server.totalRequestCount._rate,regionserver.Server.writeRequestCount._diff&appId=hbase&startTime=14000000&endTime=14200000
http://<AMS_HOST>:6188/ws/v1/timeline/metrics?metricNames=regionserver.Server.readRequestCount._max._diff&appId=hbase&startTime=14000000&endTime=14200000
Specifying Wild Cards
Both metricNames and hostname take wildcard (%) values for a group of metric (or hosts). A query can have a combination of full metric names and names with wildcards also.
Examples
http://<AMS_HOST>:6188/ws/v1/timeline/metrics?metricNames=regionserver.Server.%&appId=hbase&startTime=14000000&endTime=14200000
http://<AMS_HOST>:6188/ws/v1/timeline/metrics?metricNames=regionserver.Server.%&hostname=abc.testdomain124.devlocal&appId=hbase&startTime=14000000&endTime=14200000
http://<AMS_HOST>:6188/ws/v1/timeline/metrics?metricNames=master.AssignmentManger.ritCount,regionserver.Server.%&hostname=abc.testdomain124.devlocal&appId=hbase&startTime=14000000&endTime=14200000
http://<AMS_HOST>:6188/ws/v1/timeline/metrics?metricNames=regionserver.Server.%&hostname=abc.testdomain12%.devlocal&appId=hbase&startTime=14000000&endTime=14200000
Downsampling
As discussed before, AMS downsamples data when higher time ranges are requested. The default "downsampled across time" data returned is AVG. Specific downsamples can be requested by adding the aggregate function qualifiers ( ._avg, ._max, ._min, ._sum ) to the metric names the same way like requesting aggregates across the cluster.
Example
http://<AMS_HOST>:6188/ws/v1/timeline/metrics?metricNames=regionserver.Server.totalRequestCount._max&hostname=abc.testdomain124.devlocal&appId=hbase&startTime=14000000&endTime=14200000&precision=MINUTES
The above query returns 5 minute data for the metric, where the data point value is the MAX of the values found in every 5 minute range.
AMS Metadata API
AMS has 2 metadata endpoints that are useful for finding out the set of metrics it received, as well as the topology of the cluster.
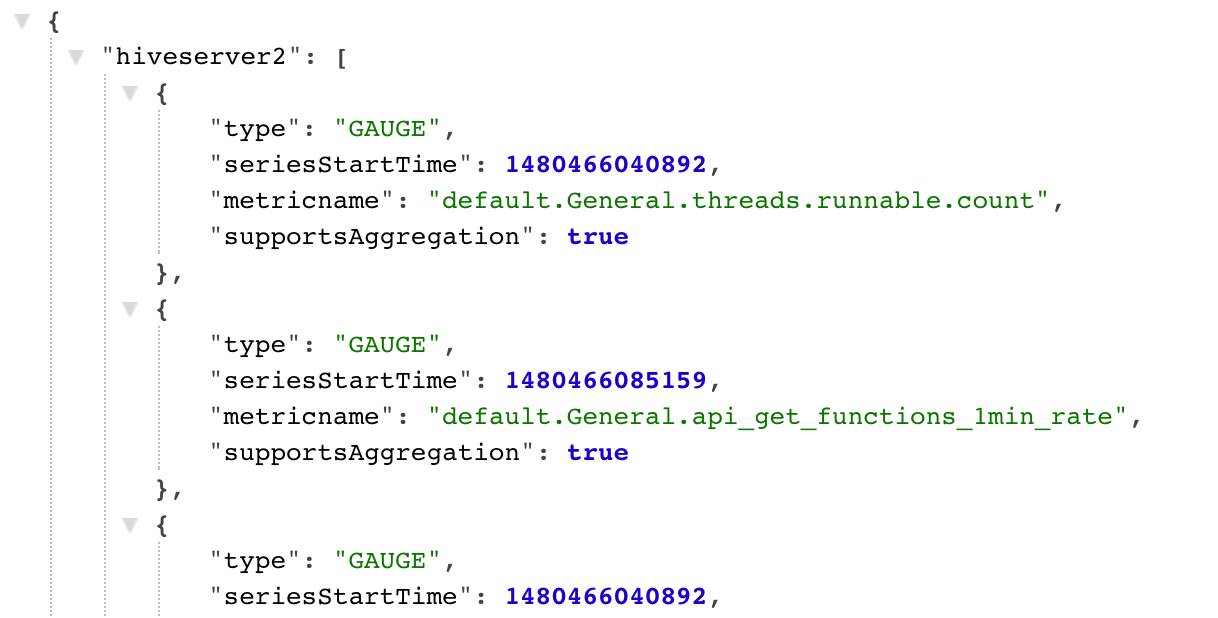
METRICS METADATA
Endpoint : http://<AMS_HOST>:6188/ws/v1/timeline/metrics/metadata
Data returned : A mapping between the set of APP_IDs to the list of metrics received with that AppId.
Sample data returned
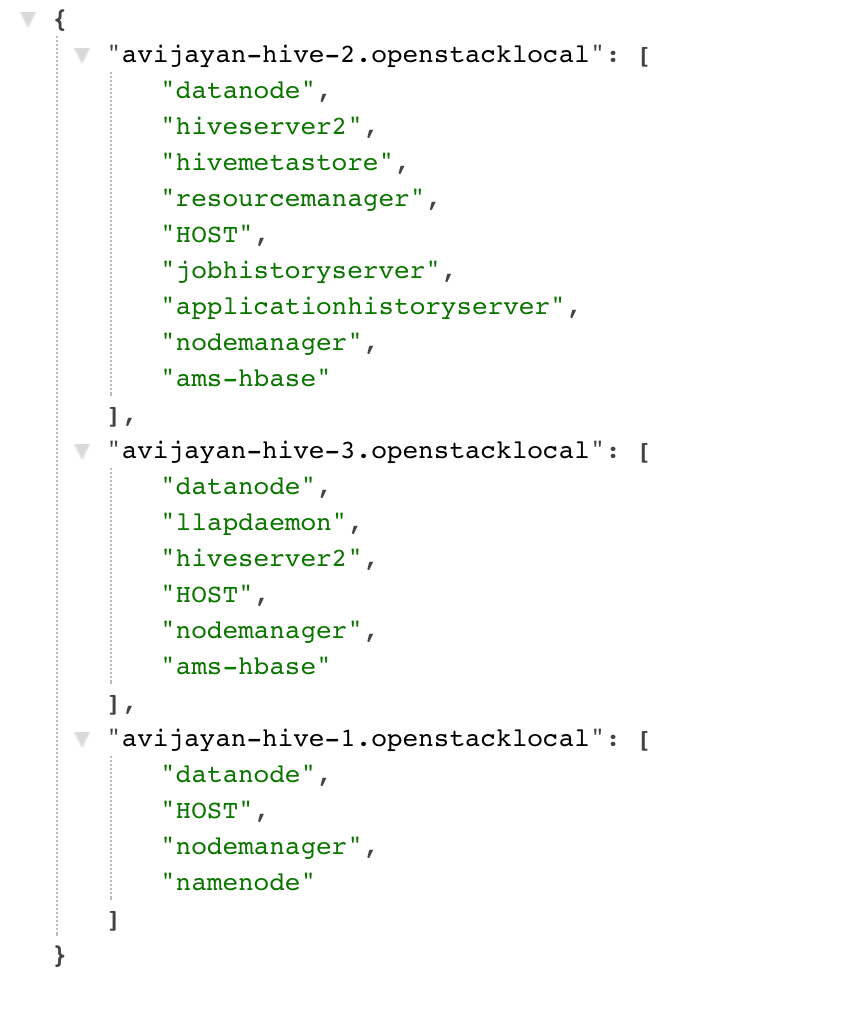
HOSTS METADATA
Endpoint : http://<AMS_HOST>:6188/ws/v1/timeline/metrics/hosts
Data returned : A mapping between the hosts in the cluster and the set of APP_IDs on the host.
Sample data returned
Internal
METRIC DATA STRUCTURE
...