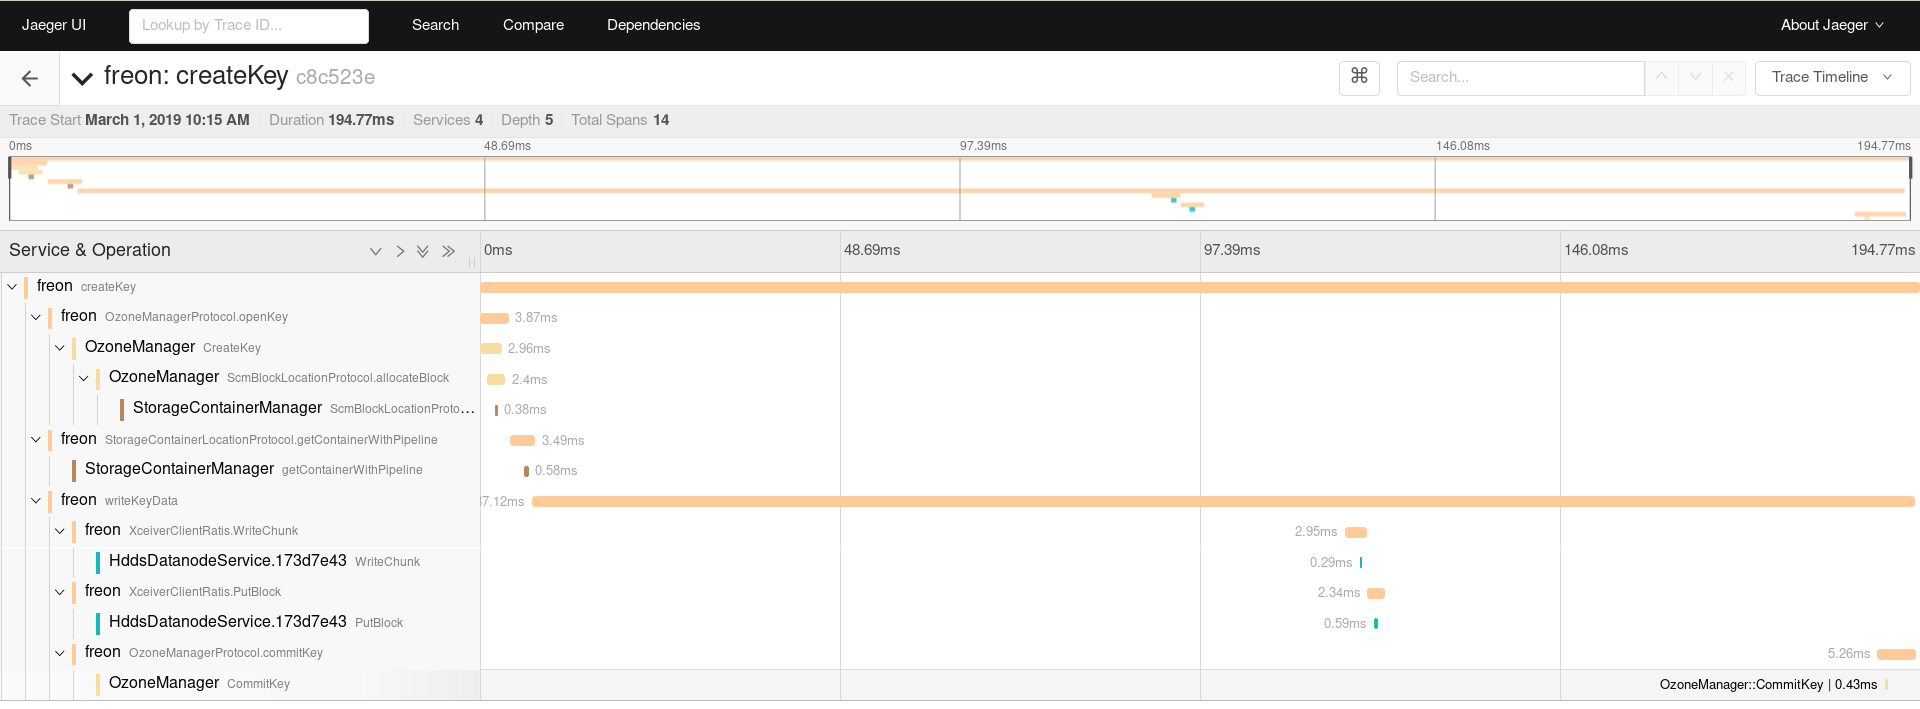
An external, end-to-end view about the performance of ozone views. As an example:
With tracing you can identify the slow components during an end-to-end test and go forward with Java Profiler on the identified component.
(1) start the cluster from compose/ozonetrace (docker-compose up -d)
cd compose/ozonetrace docker-compose up -d docker-compose scale datanode=3 |
(2) start a simple freon test
docker-compose exec scm ozone freon rk --numOfKeys=10 --numOfBuckets=10 --numOfVolumes=10 --factor=THREE --replicationType=RATIS |
(3) Check the output of the tracing. Open http://localhost:16686/search in your broser
How to use it in my own cluster.
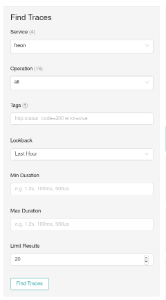
(4) Select freon service and click to the Find Tracing.
(5) Click to any of the results on the right hand side:
The first line represents the full time. Under the first line you can see the time of specific subsystems. The first (bigger) name in the line is the name of the component. The second one is the name of the trace (usually a method name)
(1) You need a jaeger server, running in your cluster. The easiest way to run it is using docker:
 dockerr run -d \
    -e COLLECTOR_ZIPKIN_HTTP_PORT=9411 \
    -p5775:5775/udp -p6831:6831/udp -p6832:6832/udp \
    -p5778:5778 -p16686:16686 -p14268:14268 -p9411:9411 \
jaegertracing/all-in-one:latest |
(2) Set the server endpoint and tracing frequency via environment variables.
How does it work?
What should I do in the code?
Dynamic method
Manual method