See below for a survey we ran on the listserv in November 2019. We received 40 responses out of a community of 342 listserv subscribers, so ~12% response rate.
This is not bad for a first time, and we may want to make this annual to get trend lines.
There are several ways in which these results can be read, and I would encourage us to not read too much into them.
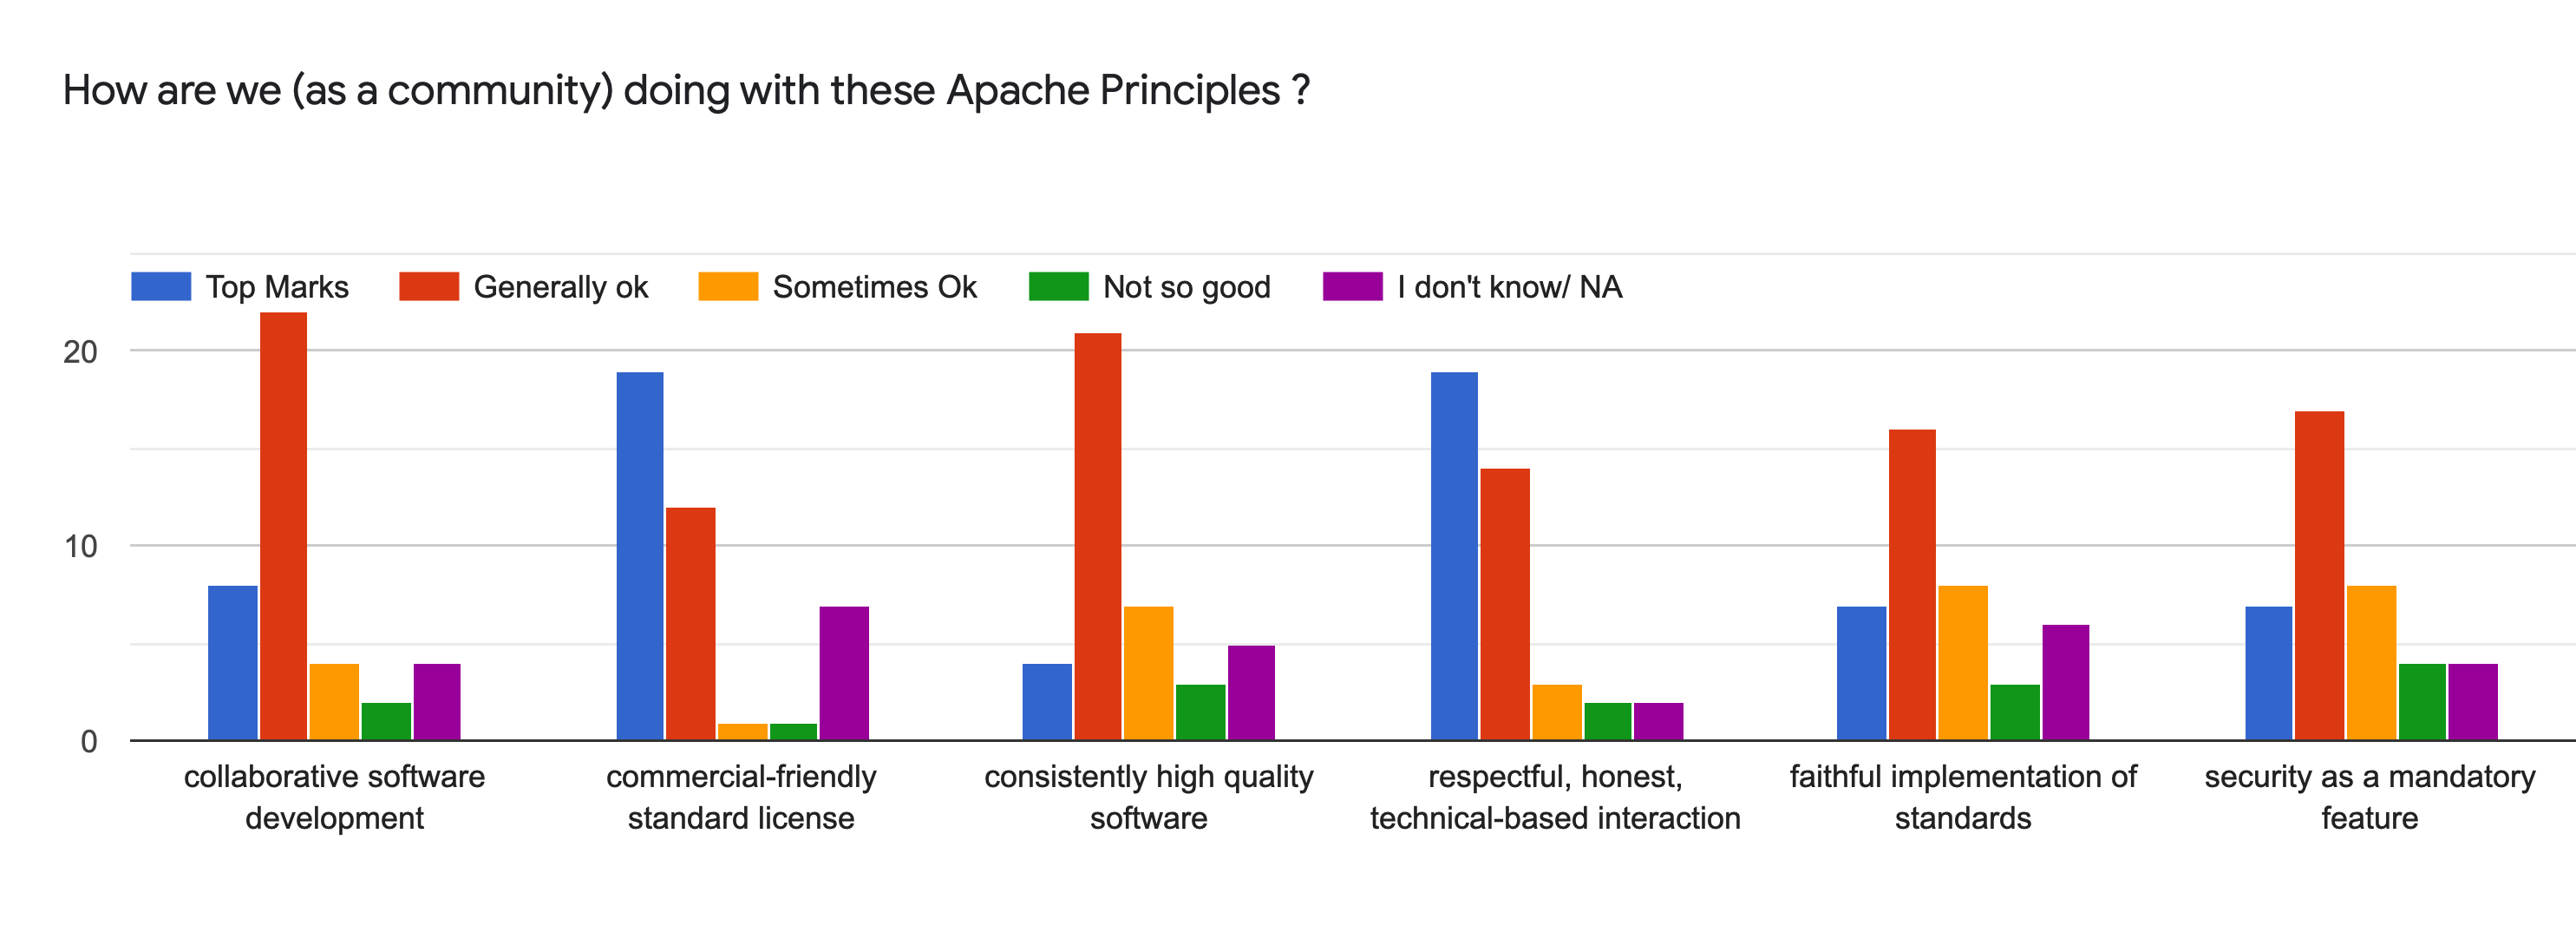
If we assume that these are representative of the community i.e. without significant bias, then I think it generally shows a project trying to encourage contributions with some challenges.
1.
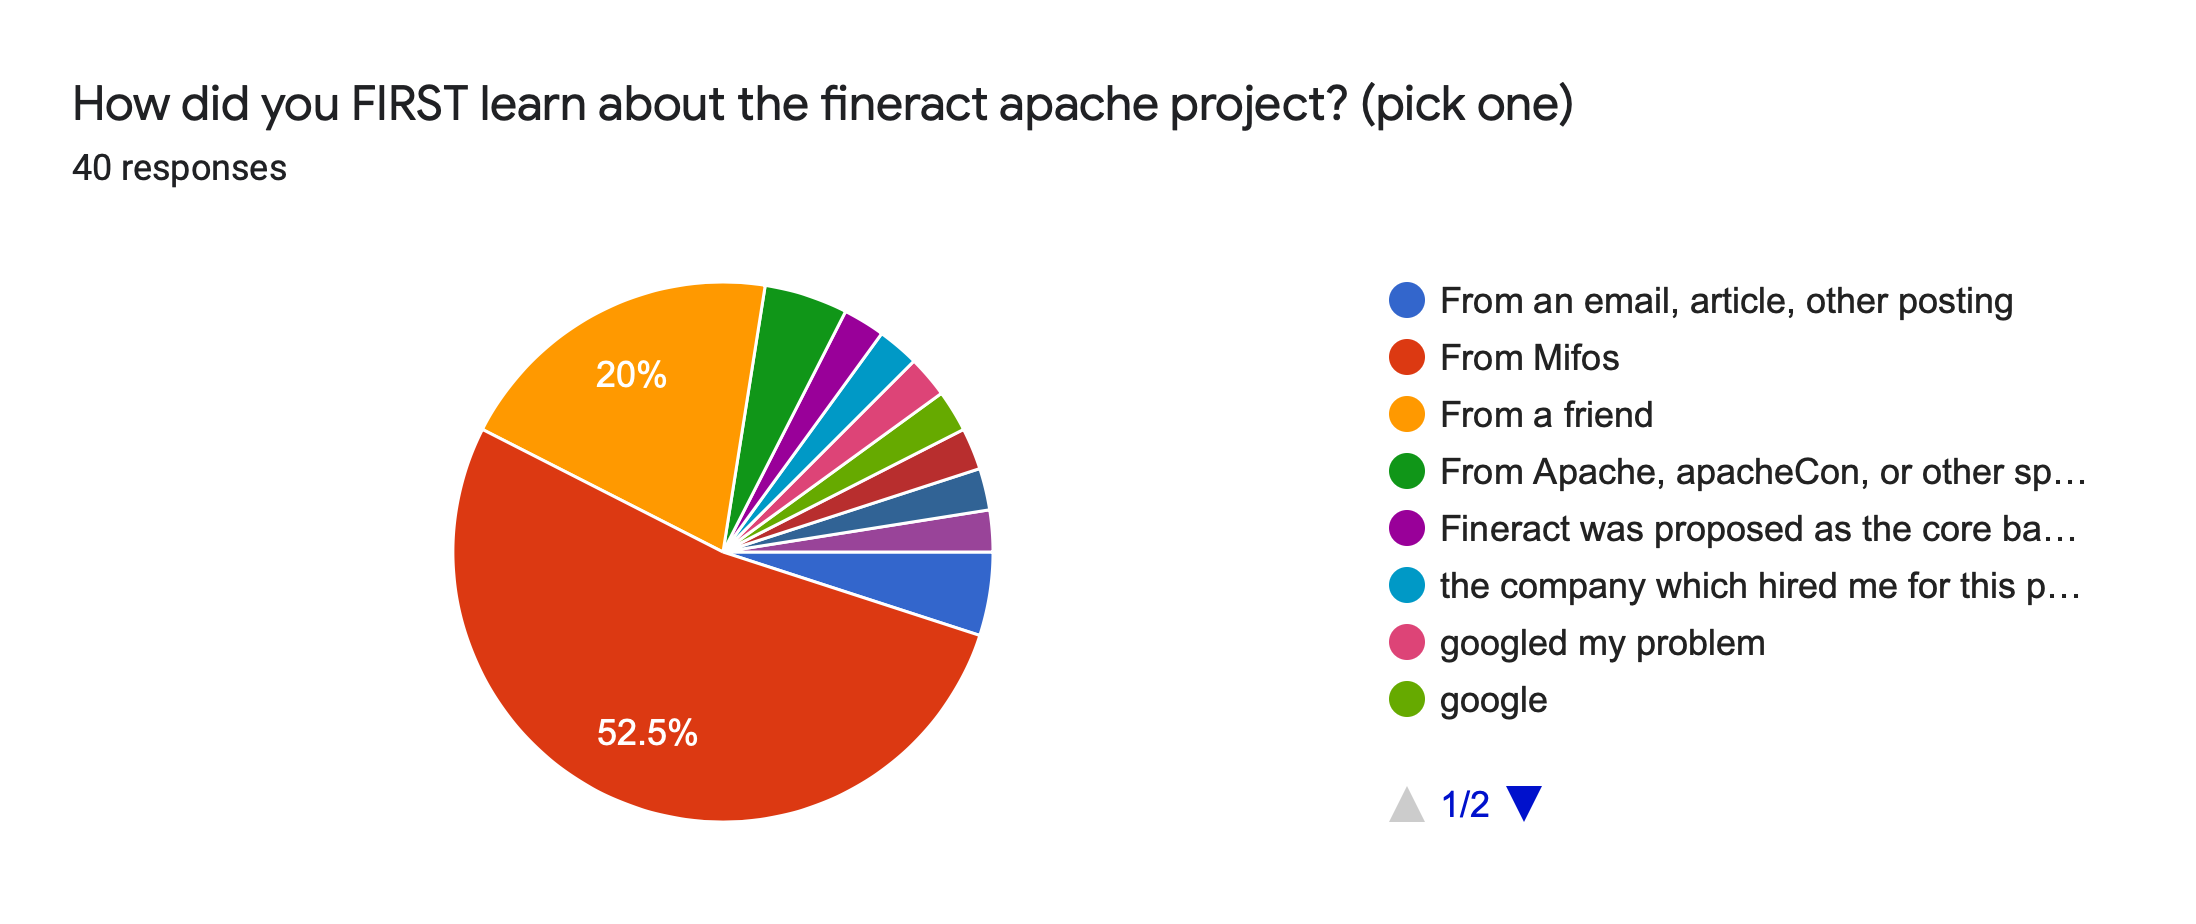
2.
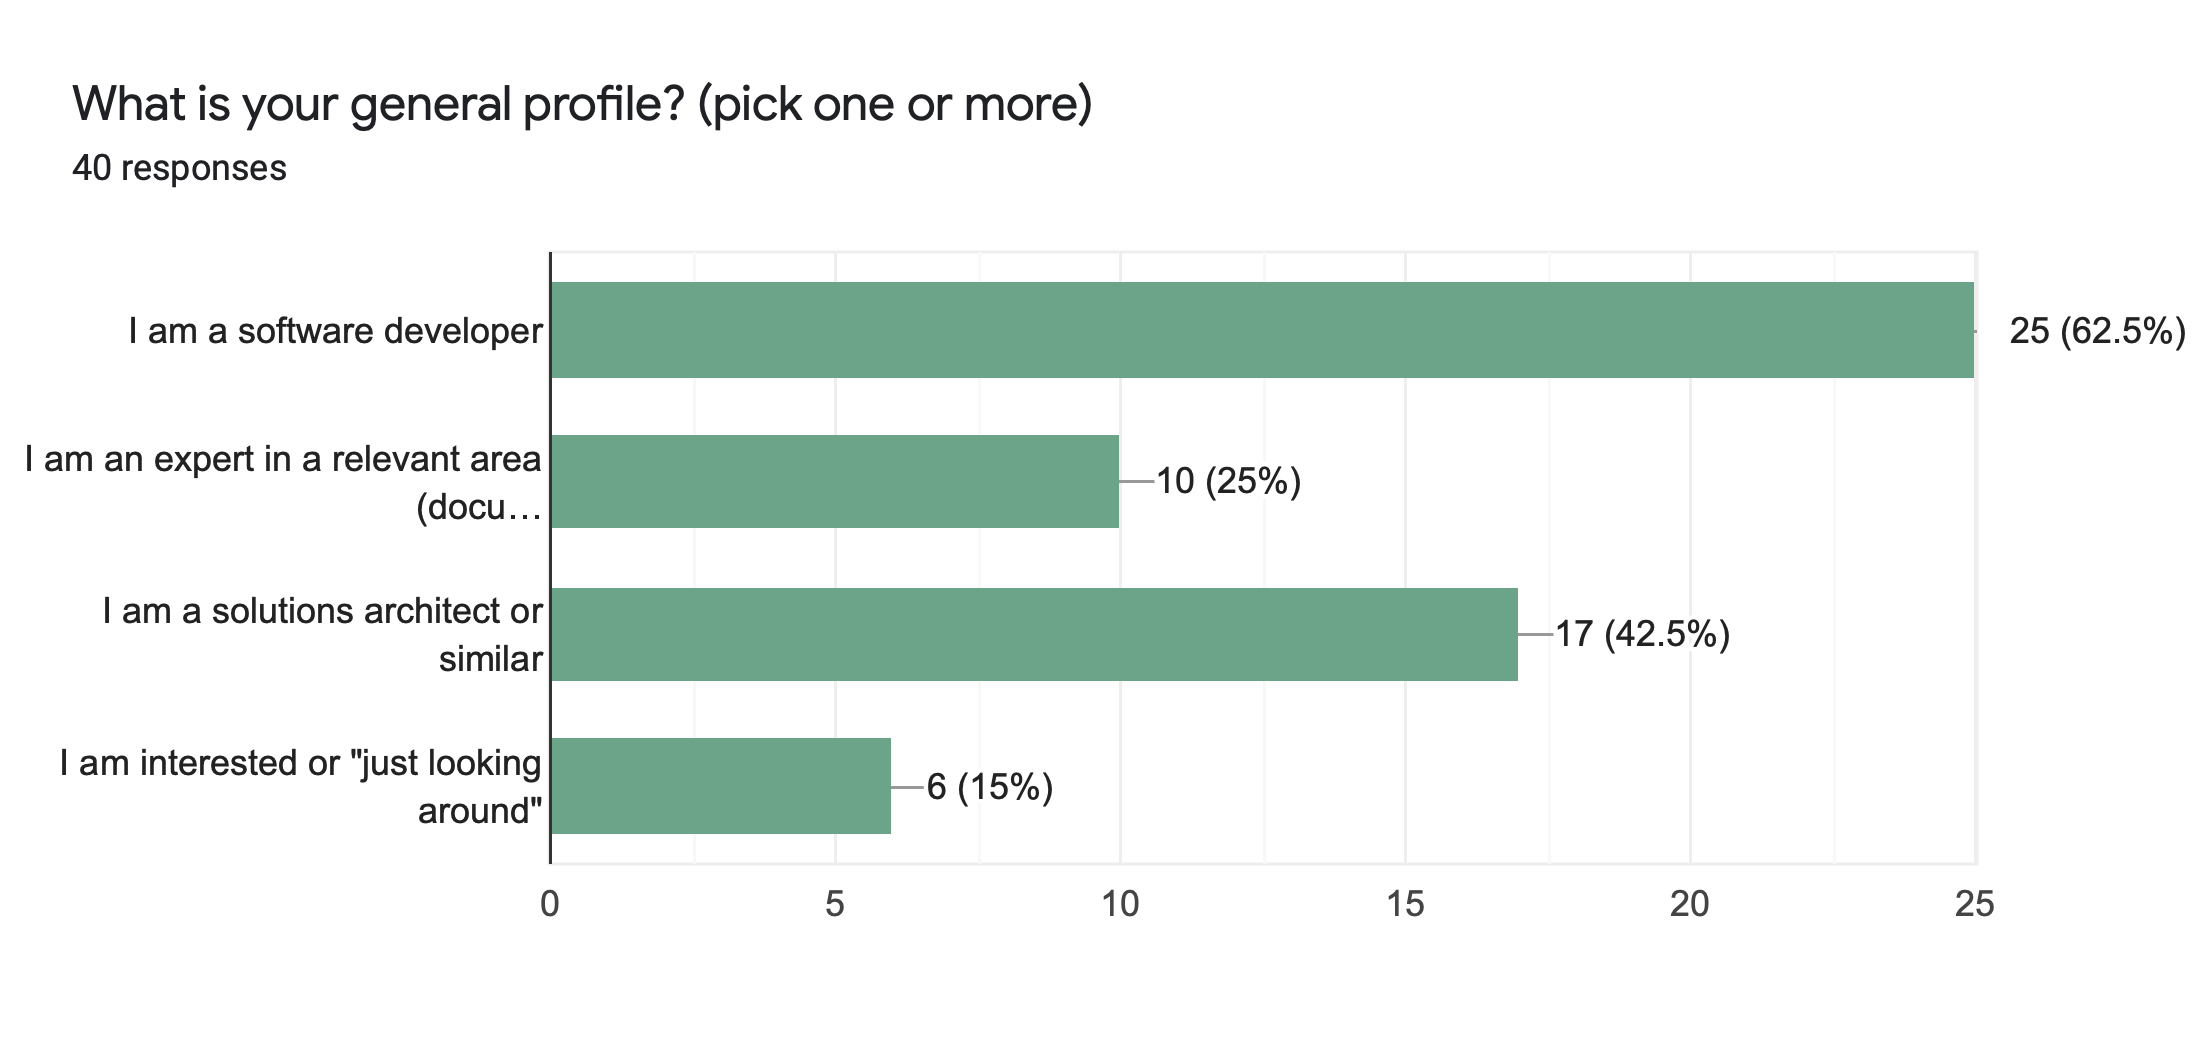
3.
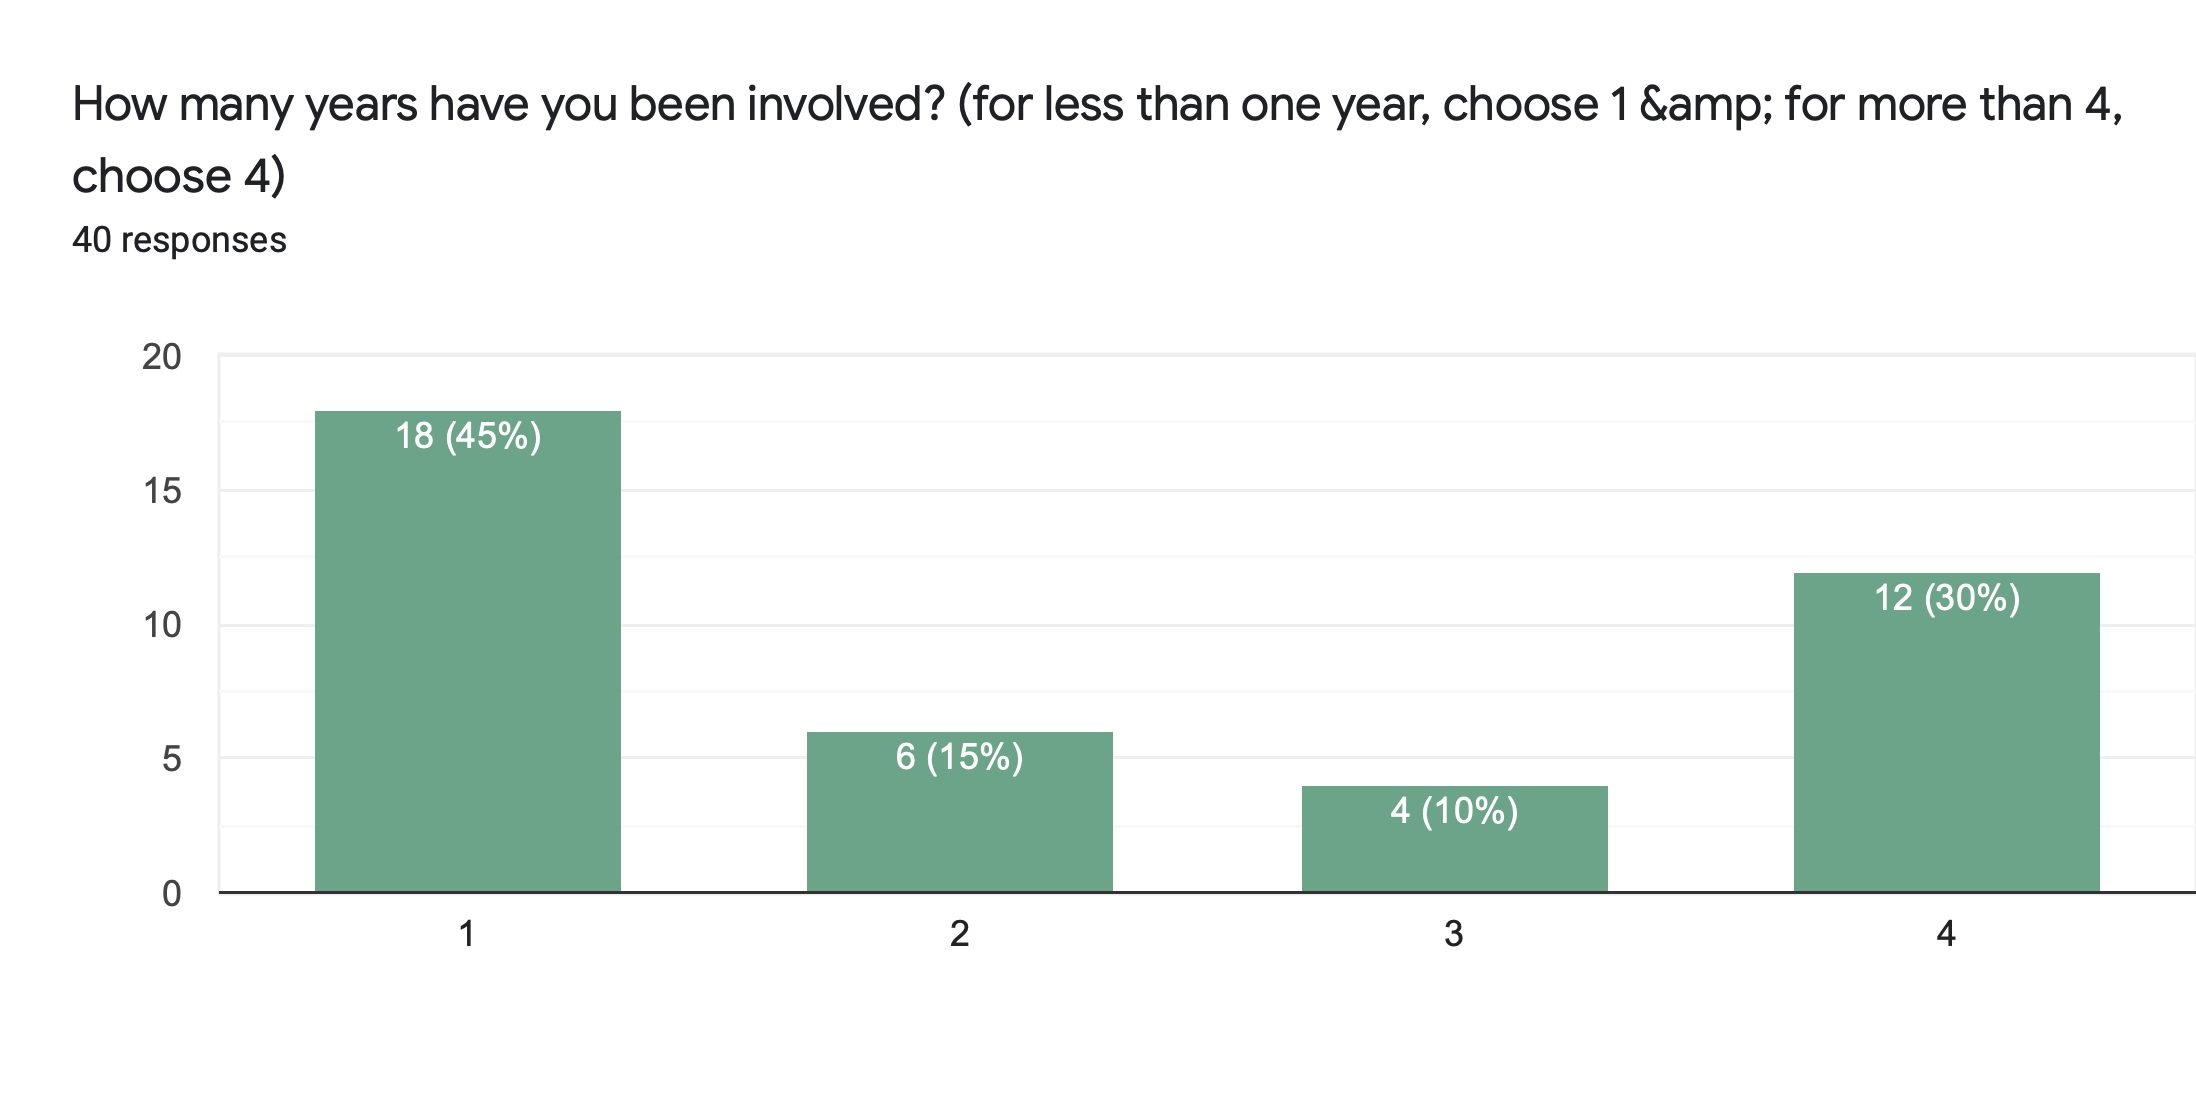
4.
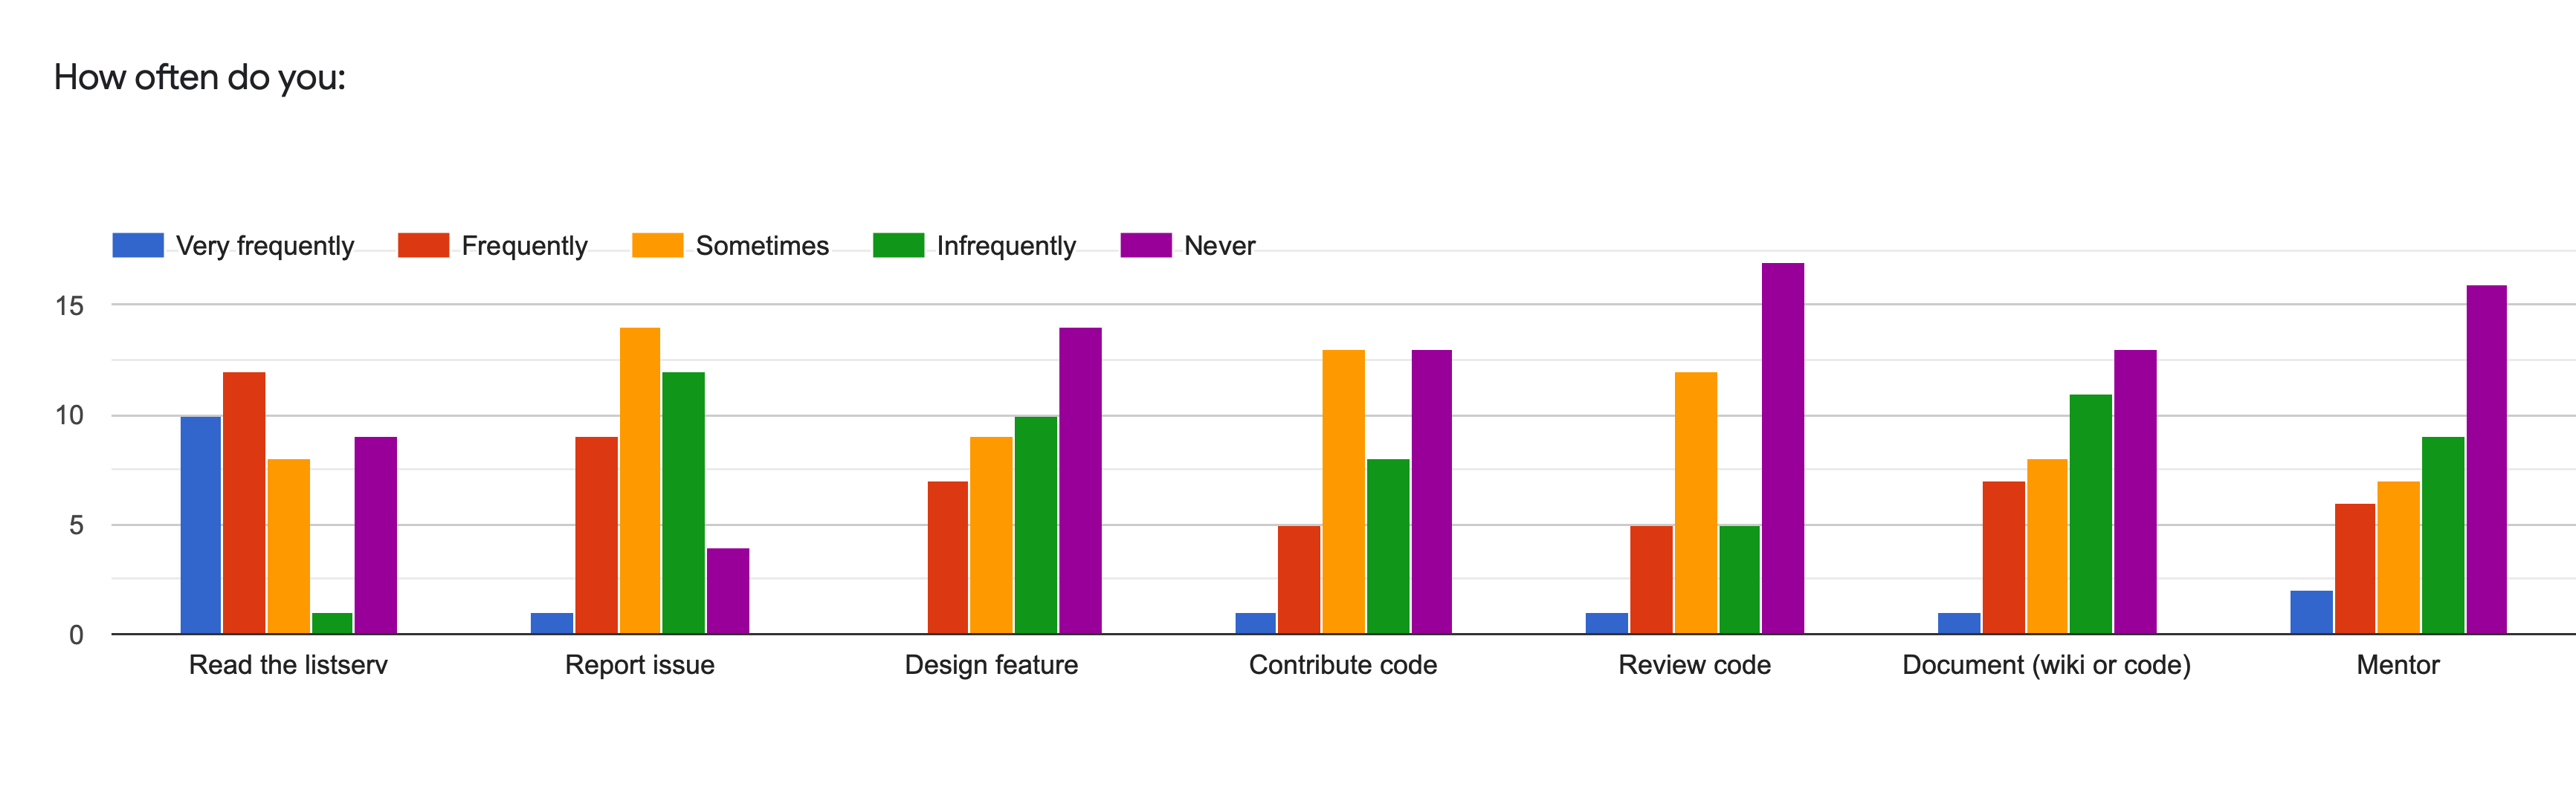
5.
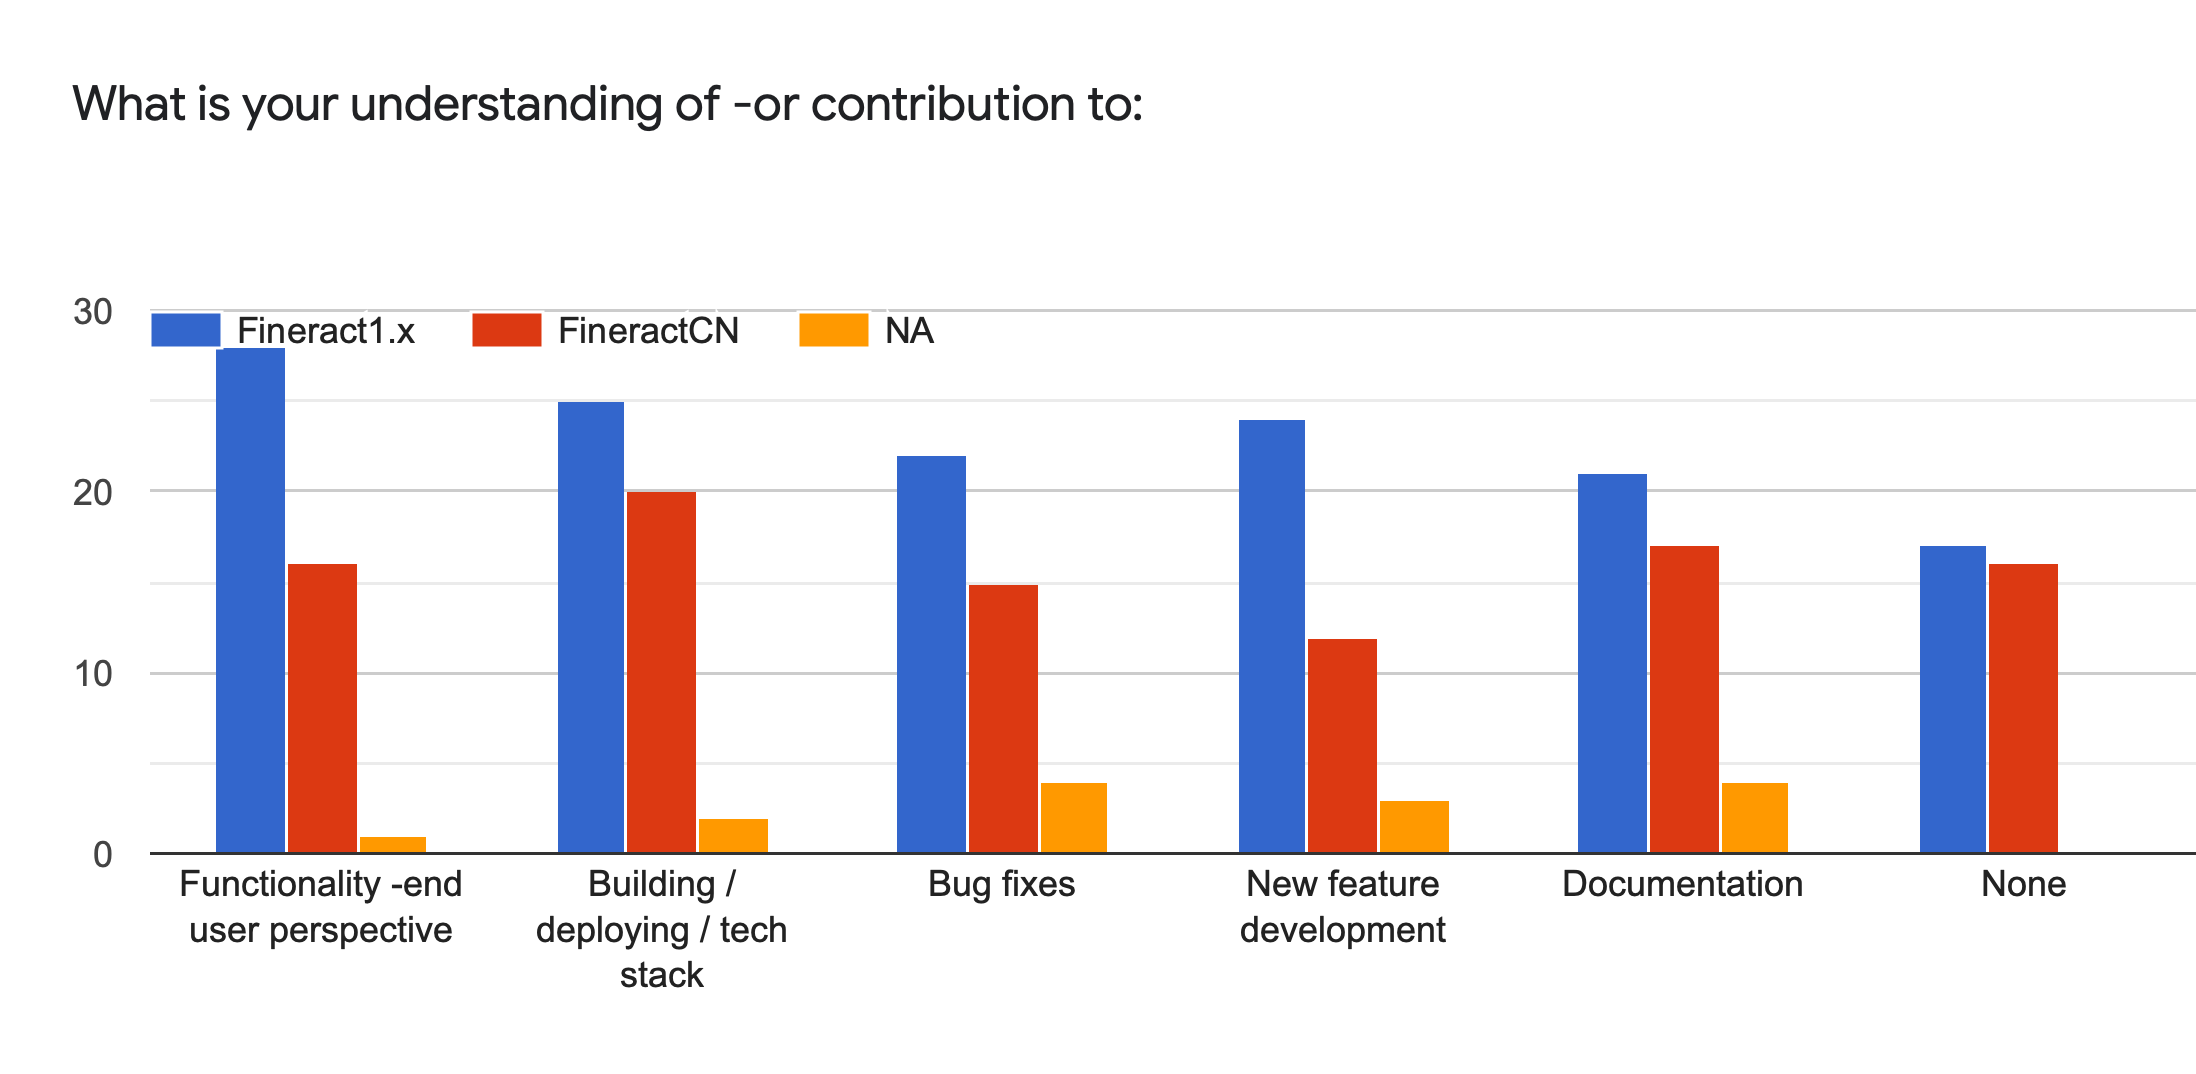
(note: this question above originally did not have an NA and was mandatory, it therefore may have generated some random responses.)
6.
7.
8.
9.
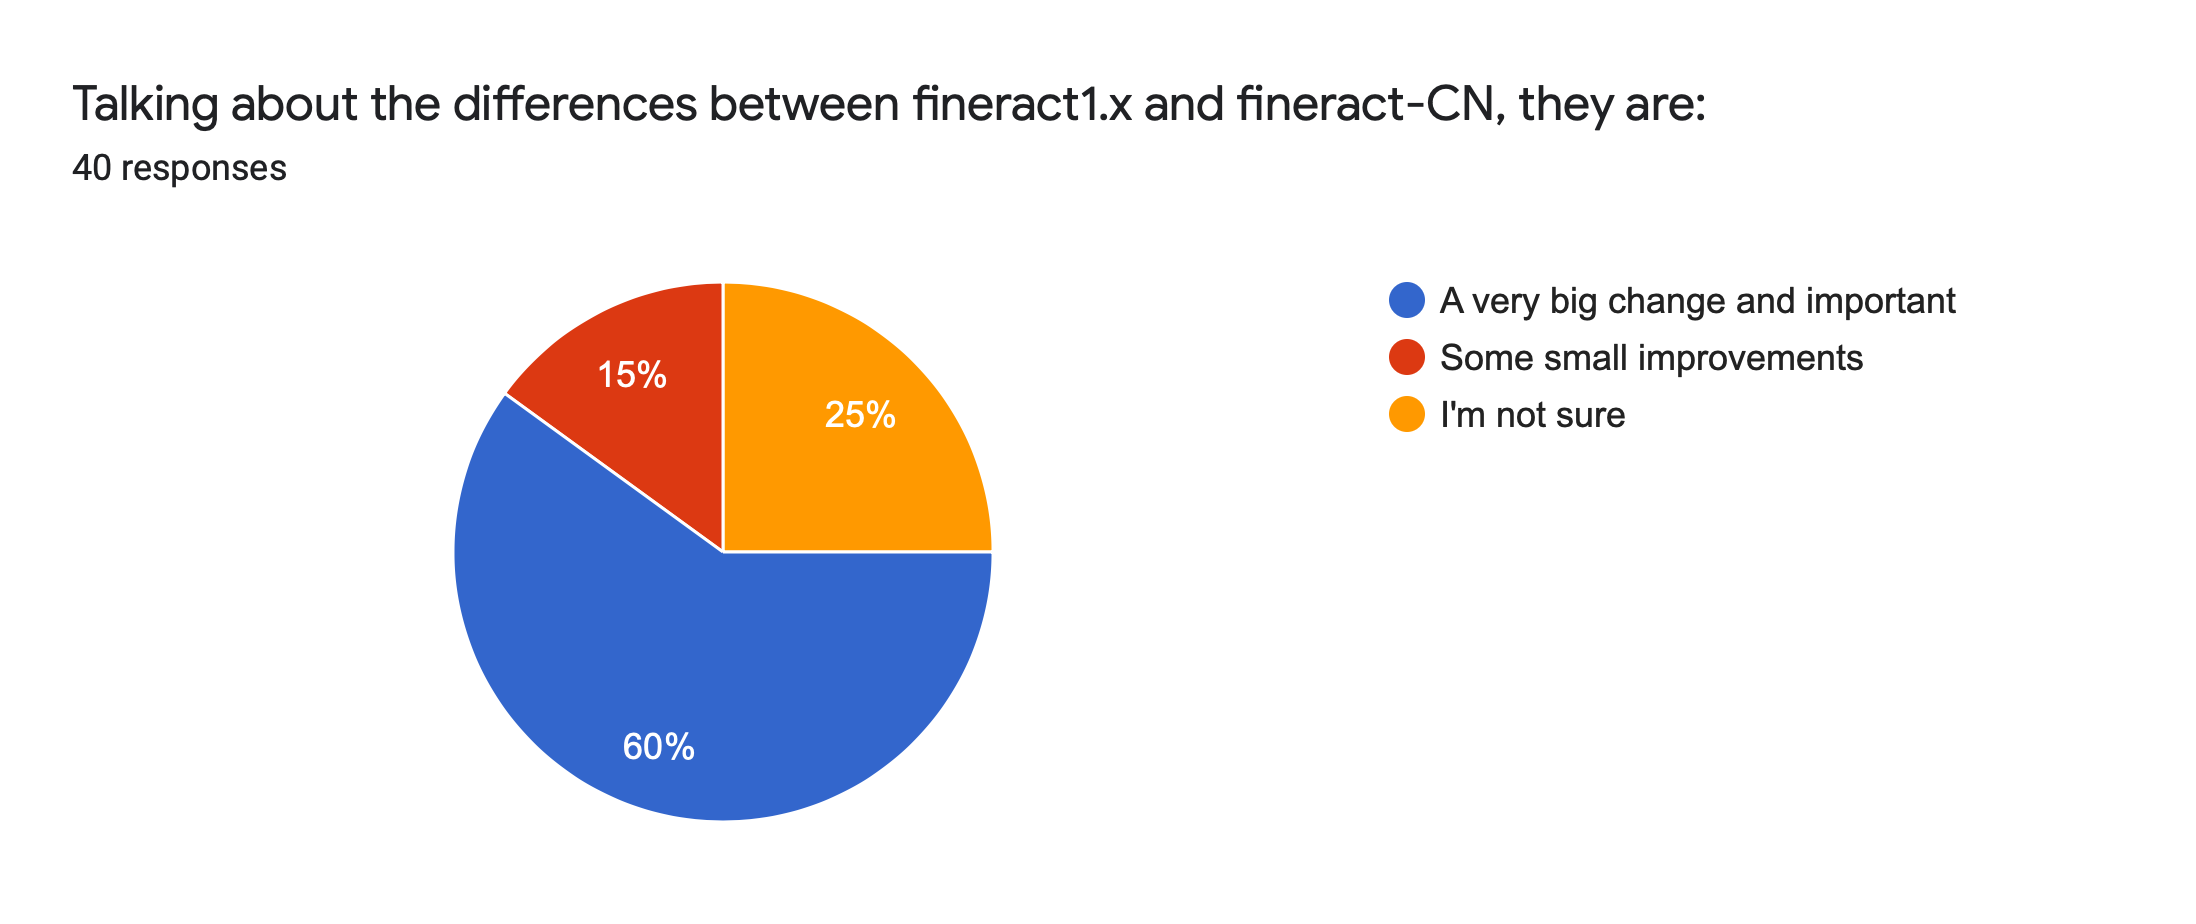
10.
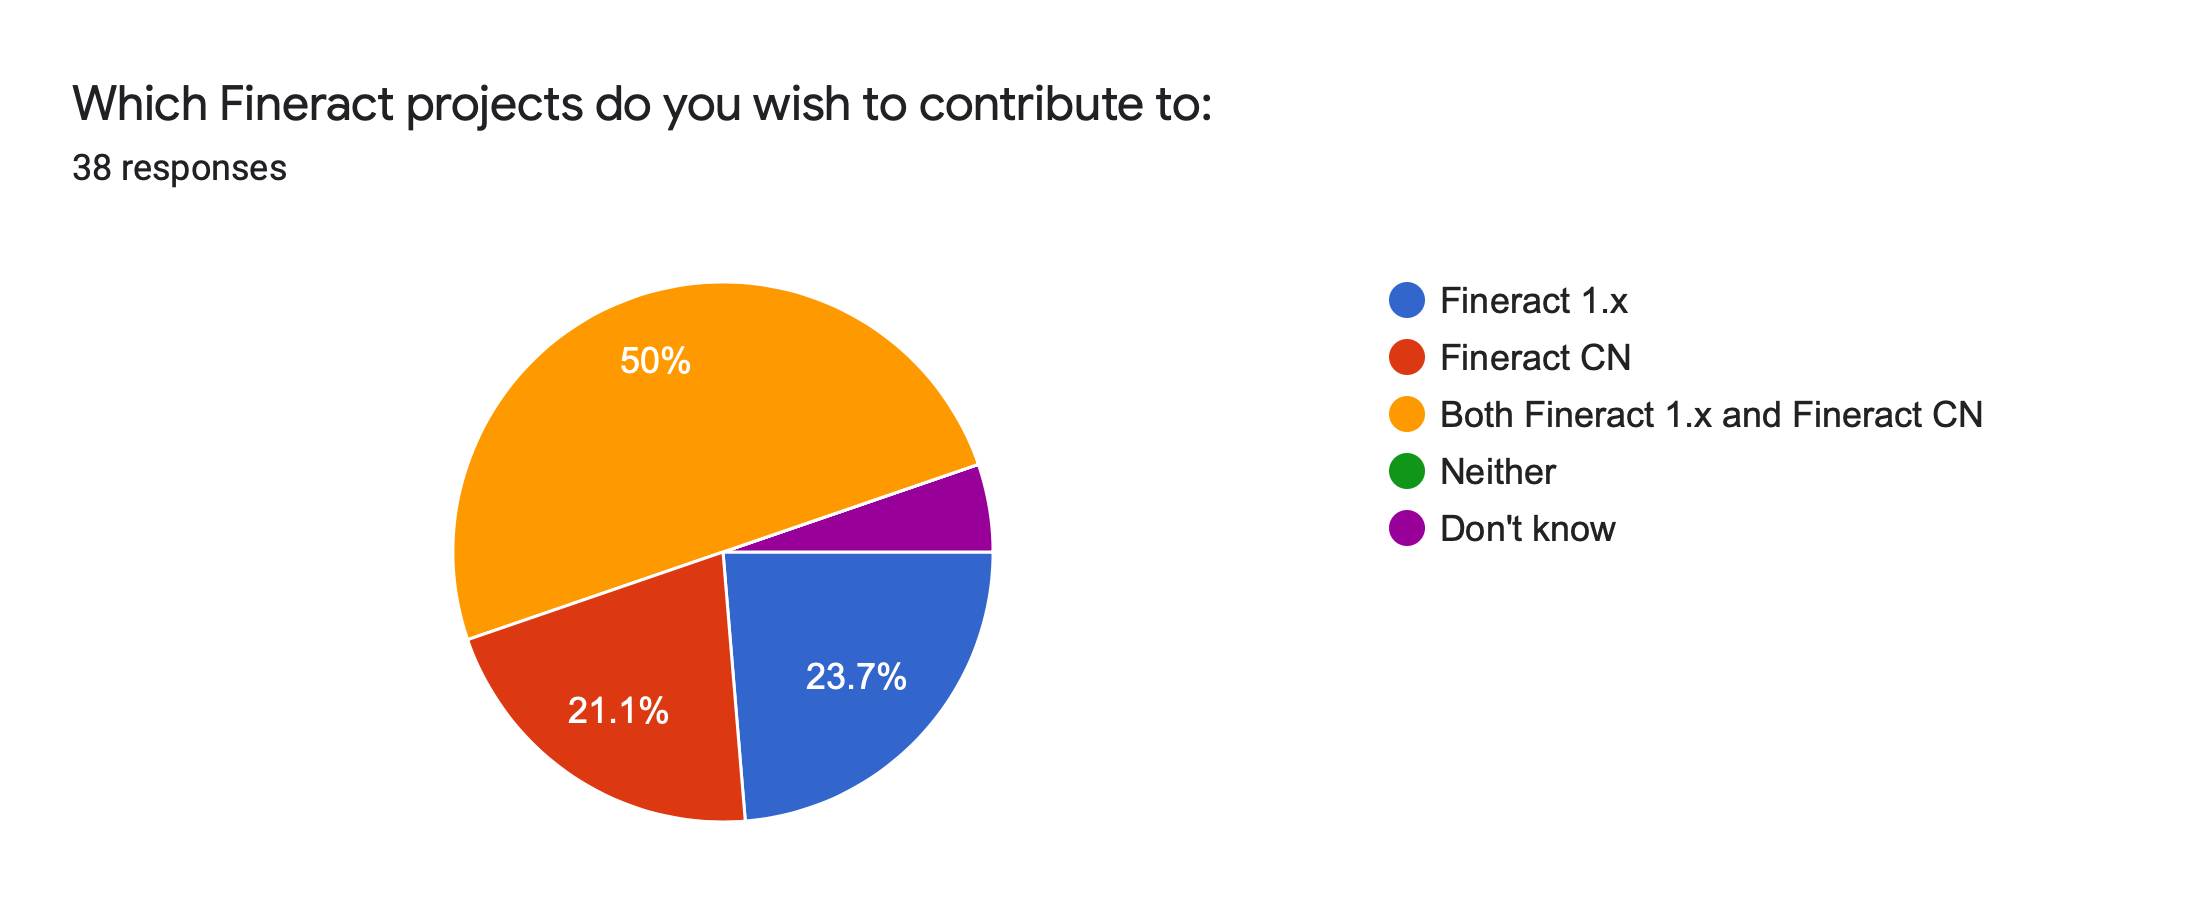
11.
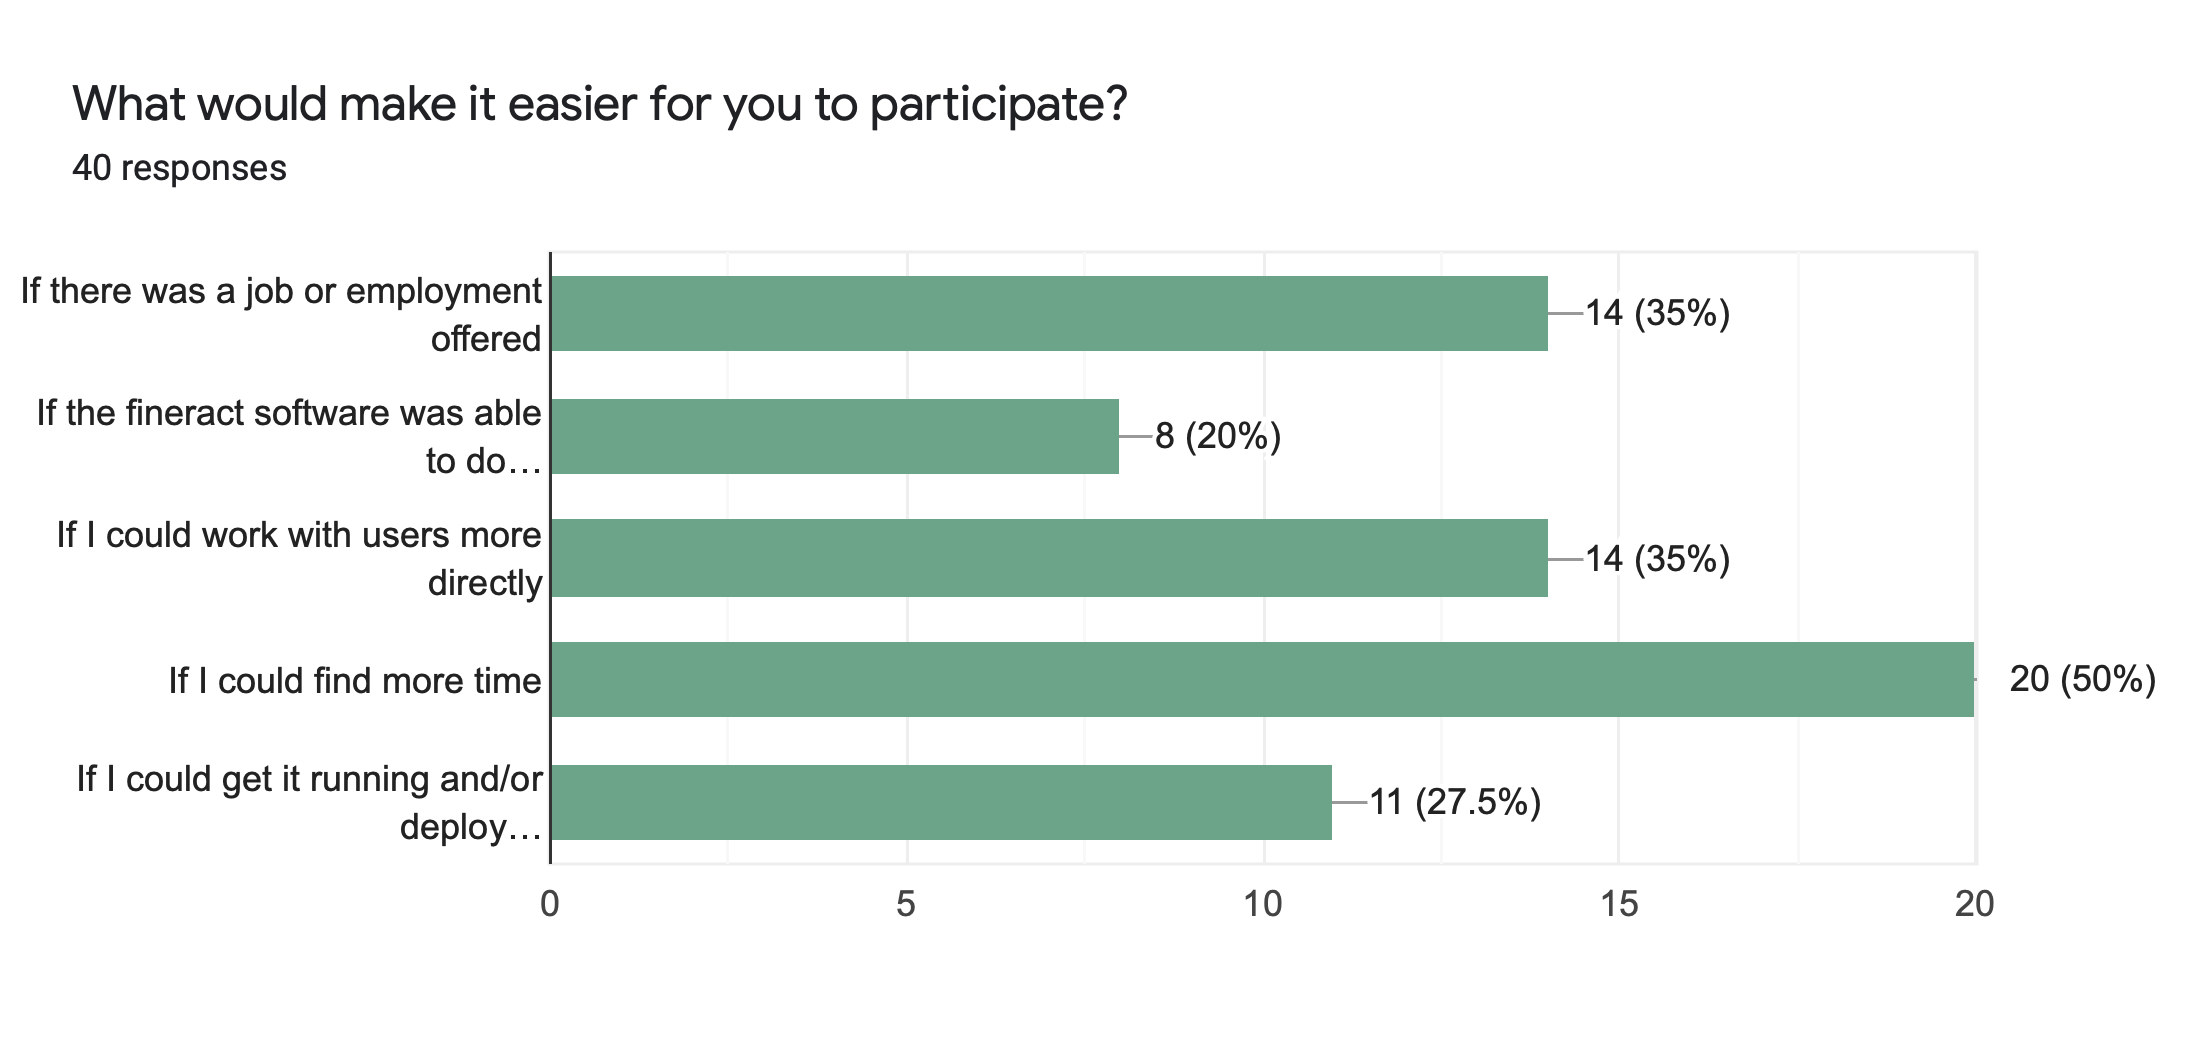
12.
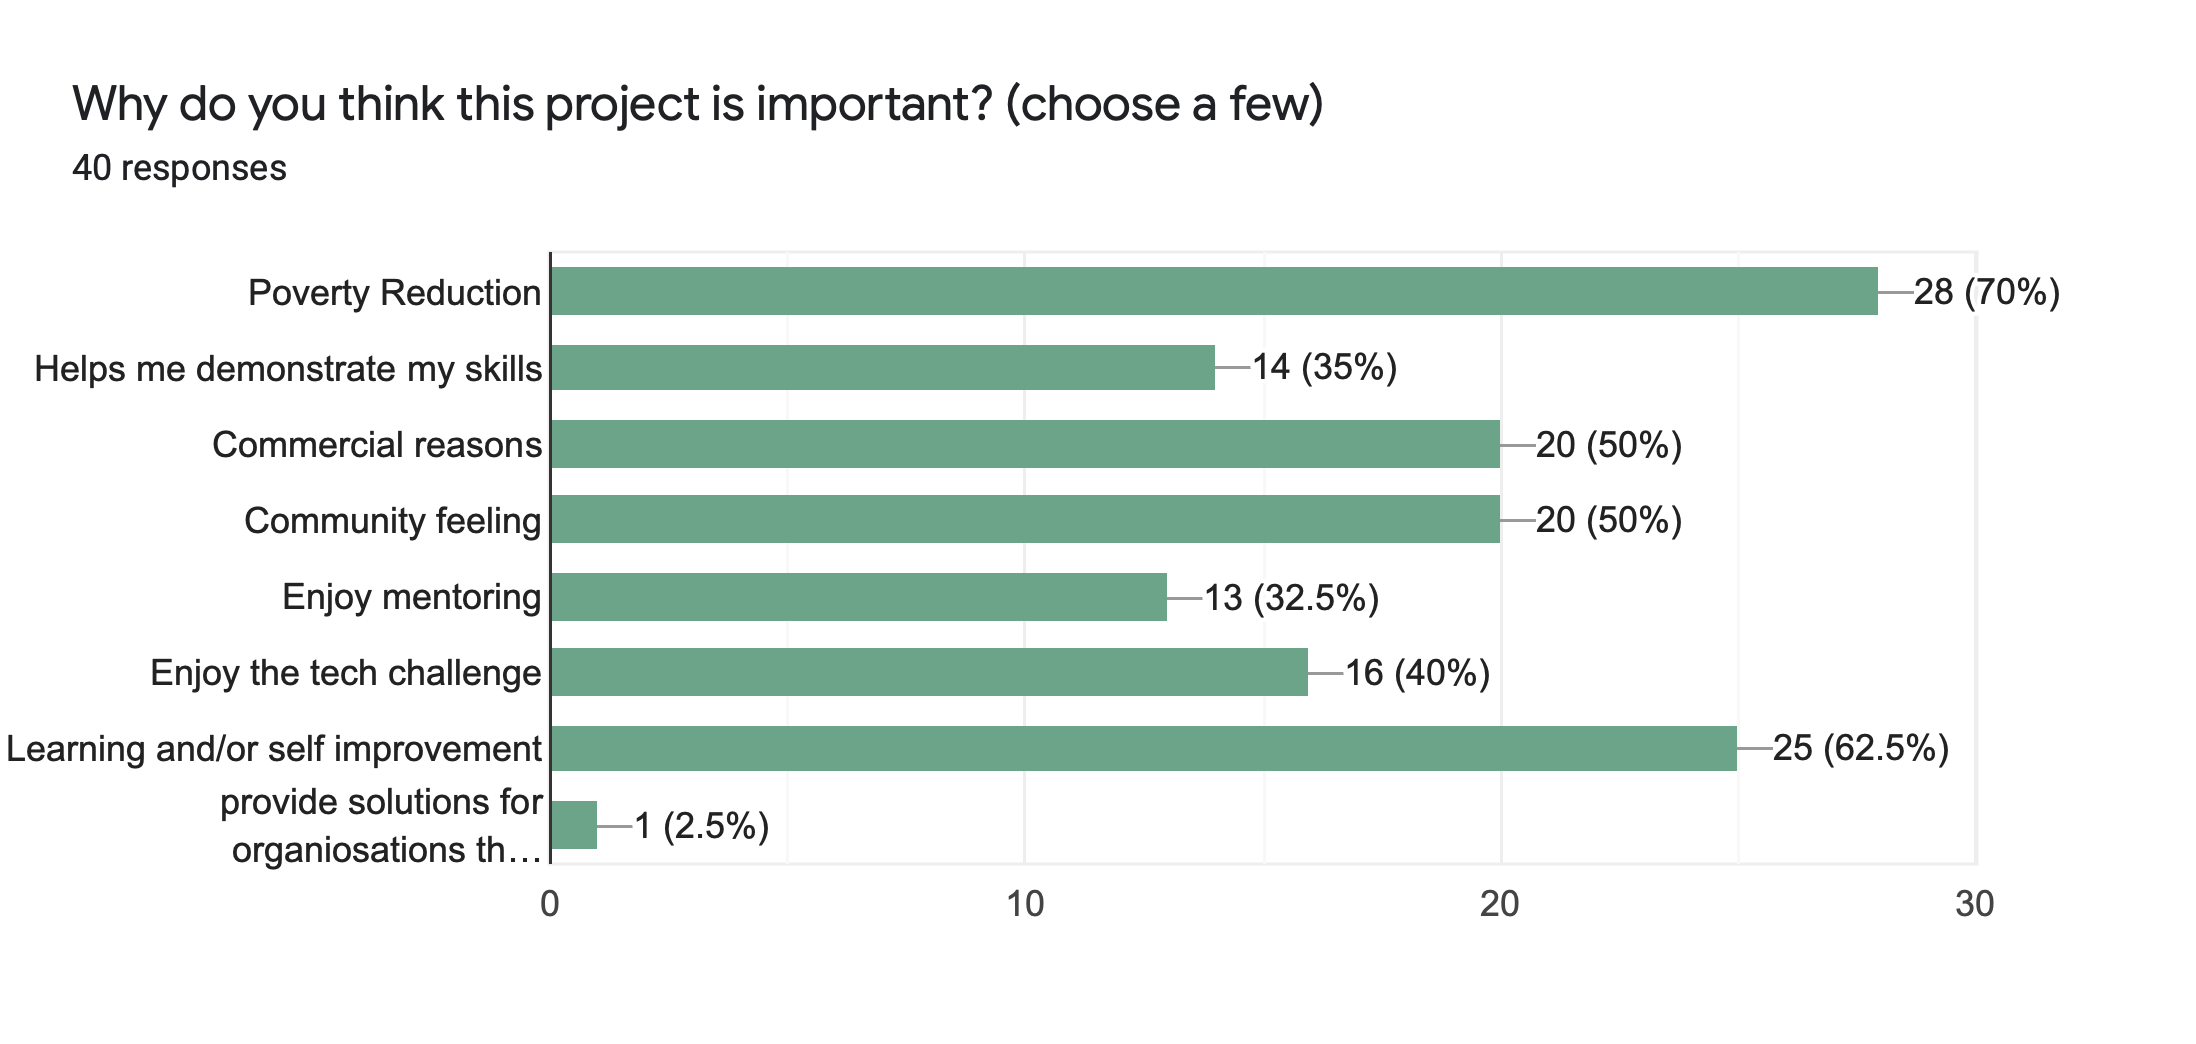
13.
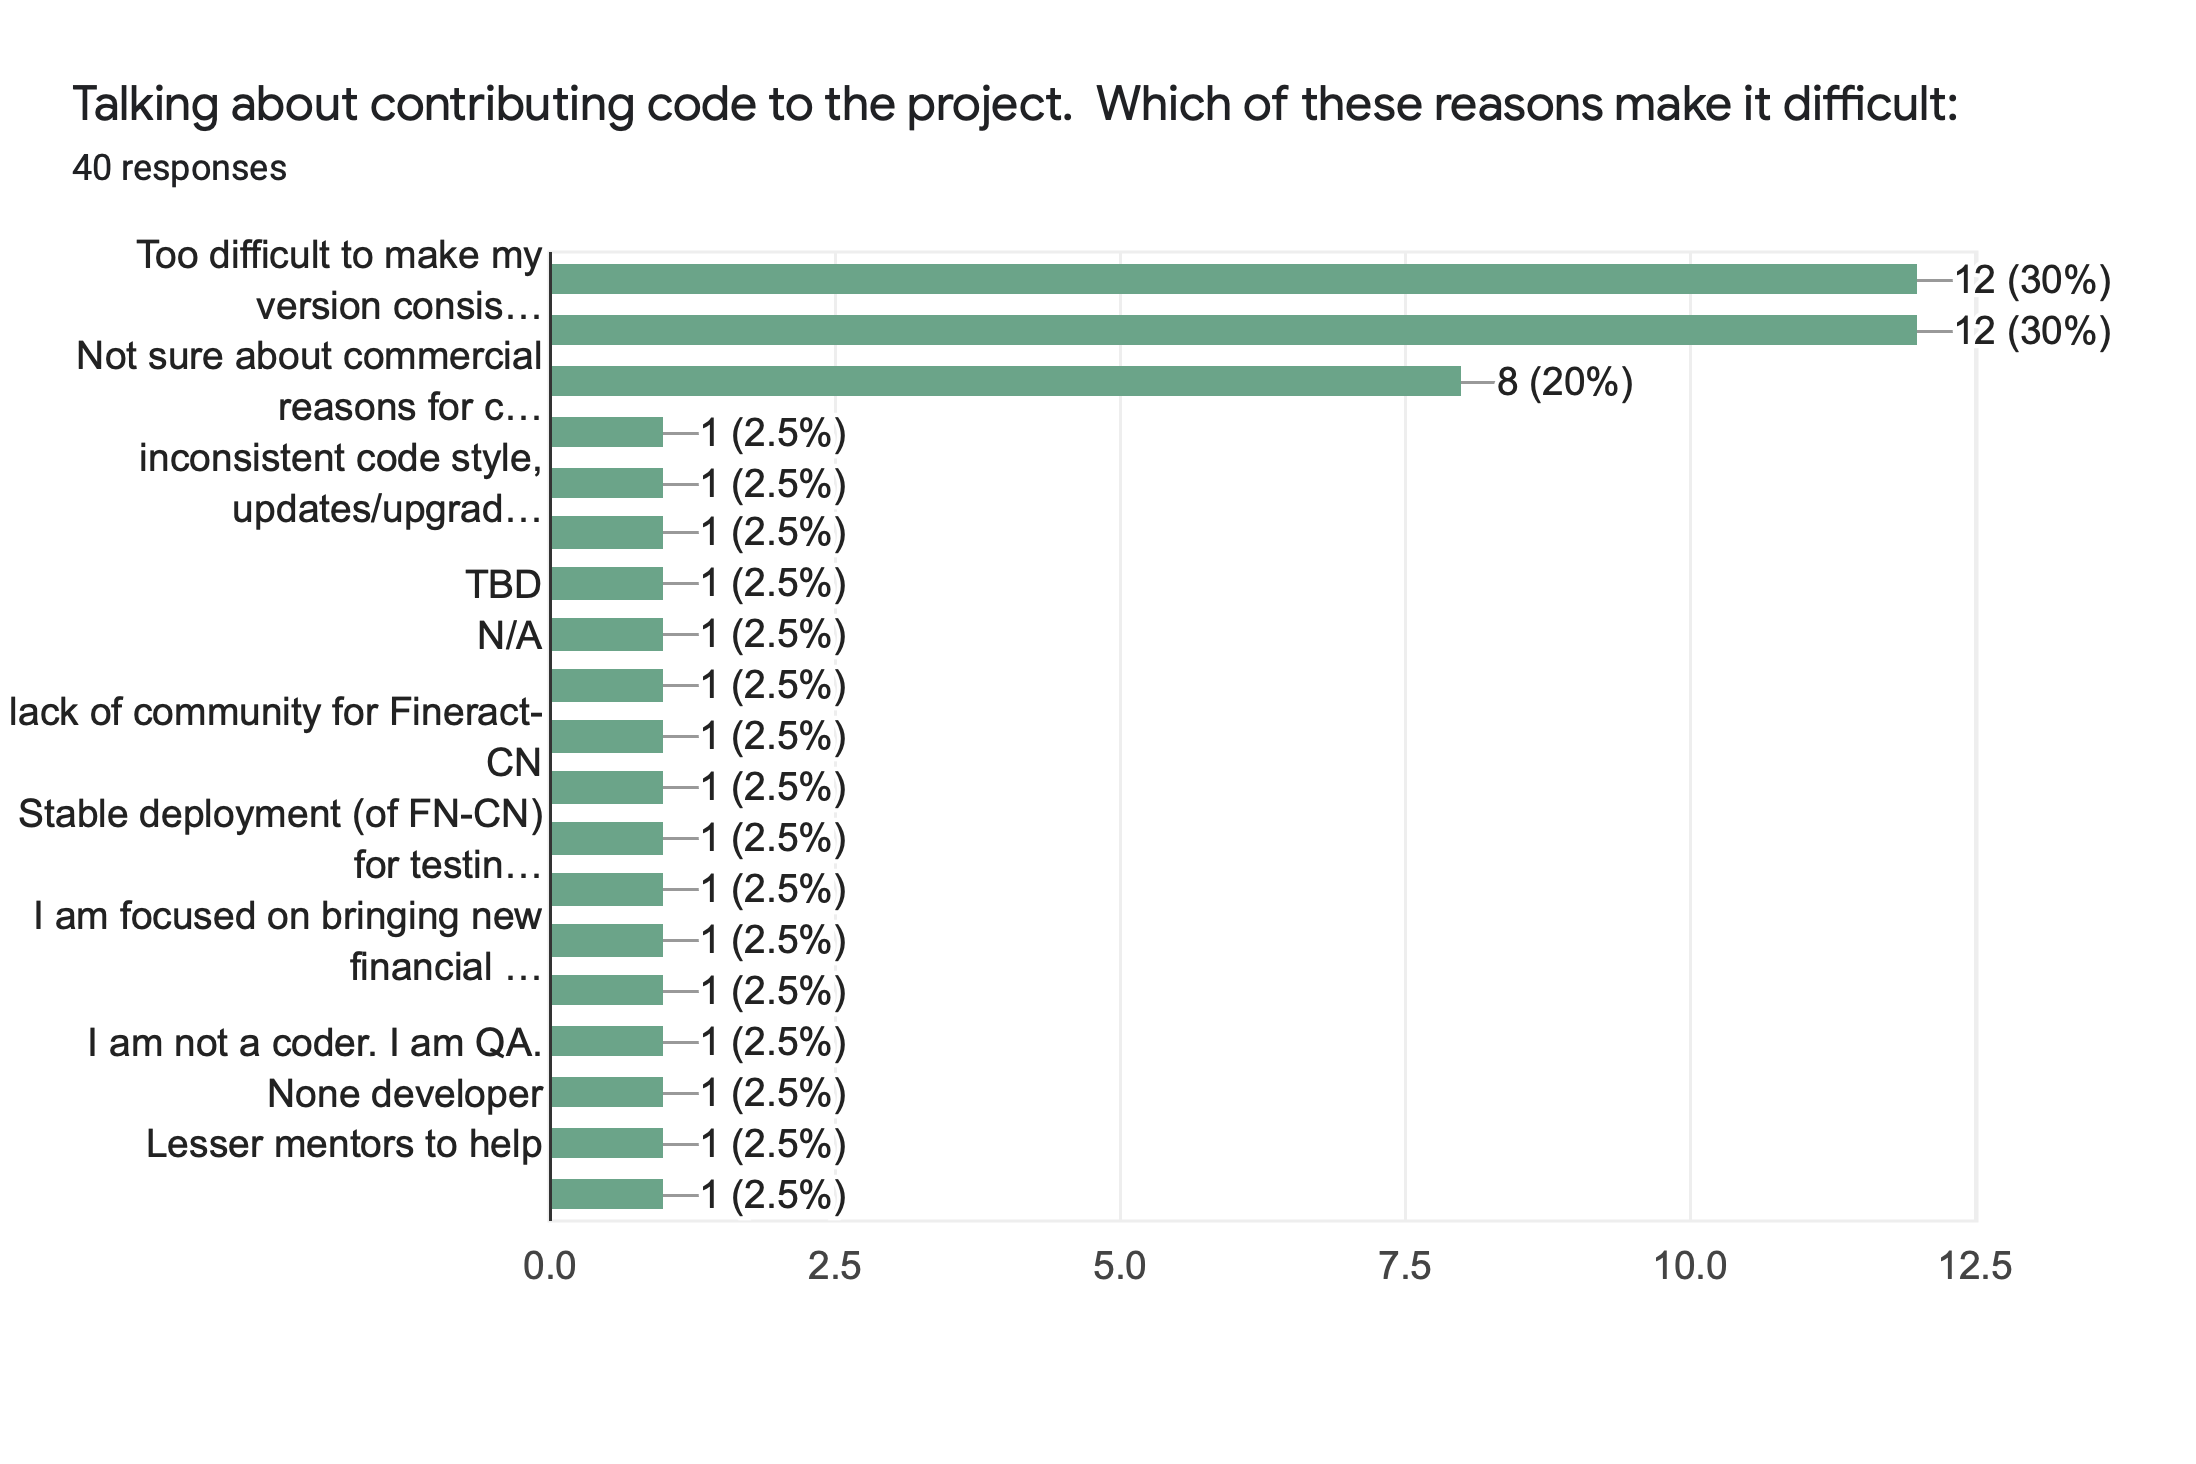
(note: the three provided answers above are:
1) Too difficult to make my version consistent with the official releases. 30%
2) Too many steps involved in release management. 20%
3) Not sure about commercial reasons for contributing 20%
and then the other answers were contributed by individuals 30% )
14.
What is your vision for this project?
- Globally relevant open source account system for every person
- Make Fineract 1.x easier to extend without creating hard forks; create a separate project just for Fineract 1.x client libraries (Java and other languages)
- this is a great project
- Open and integration ready infrastructure for 3rd party tools and microservices
- I really like the idea, I didn't knew anything about Fineract before but it seems like a viable solution to everyone who wants to keep control of loans and savings regardless their economic situation. In the future it could even be viewed as the standard solution to this kind of requirements.
- A lot of potencial, but disorganized community. We are reinventing the wheel privately: We fix code and create features in our homes. But we dont share with community.
- Make it feature rich enough to support wide variety of financial service use cases to attract mid-sized institutional customers.
- Inclusive solutions that will bridge unnecessary gaps in financial transactions
- I'm afraid CN is too complex to be developed by community. It would need a company working closely on it (don't know why they would do it :-) )
implement wallet system - Open source project will replace other tech in the next 10 years
- Transform the lives of people in DRC by providing banking services providing the economic stimulus they need through financial education and services.
- To deploy it on Fedora. To add features that will make the project relevant to Ghanaian financial comapanies
- Fintech for the underbanked
- This project has an enormous opportunity to capture a big market share of the financial institutions.
- To have a core banking solution that is production ready and can compete with the leading software providers.
- To contribute with the Mexican environment with the regulation
- Banking the unbanked
- To make it world class and most preferred banking system
- Participate and reducing poverty one line of code.
- Substantial releases coming out more frequently.
General feedback - other improvements?
- More sustained contributions from commercially related people. Vibrant contribution.model.
- Generally updates/upgrades should happen more often; both (1.x and CN) are several versions behind with main frameworks (especially Spring, Spring Boot)
- Thanks, keep up the great work!
- Over the features I've tried to configure there've been many times when I wonder if everything was calculated ok or is doing the expected behaivor. Also, some operations like daily penalty creation have been a headache in test with penalty creation being slower every time the loan gets older.
- Thanks for putting this survey together. I look forward to hearing the results! Best, M.
- Suggestions: Do "community sprints" Weekly dev newsletter: Encourage upvote bugs and features, and search assignees can help fast delivery. Communicate the whos, the whys and keep developers and community in the loop about what is being fixed in next release.
- Lets maintain the culture and build checks and balances that will further the dream of the community.
- A training school or platform is required to help new developers
- Great vision and although I am not a java developer I have a strong business and technical background. I wish to be involved in testing the system.
- Get Fineract-CN codebase better documented and more stable, then contribution will be easier.
- We need to improve on community bond and building
- Revive mifos.cloud.answerhub and remove the spam posters. Or provide a proper forum or stackoverflow type site. I find it difficult to search for past topics in the mailing list. If possible, have a repository of common problems faced when Fineract 1.x or CN is deployed in production. Roadmap for Fineract 1.x and CN.
- PCI Compliance for Card Management
- Great
- Start again with Community feature request collection, implement features requested by community, engage more core developers to add more new features that are pending in our roadmaps
- Not so easy for a lay person to get started on FineractCN.