Current state: Released
Discussion thread:
JIRA or Github Issue:
Released: 1.2.0
Google Doc: <If the design in question is unclear or needs to be discussed and reviewed, a Google Doc can be used first to facilitate comments from others.>
MemTracker: tracks memory consumption via manual calls to Consume()/Release(), it contains an optional limit and can be arranged into a tree structure.
Currently, only a small part of the memory of BE is tracked, which makes it impossible to locate and limit the memory usage of processes and queries, which affects the stability of Doris. The details are as follows:
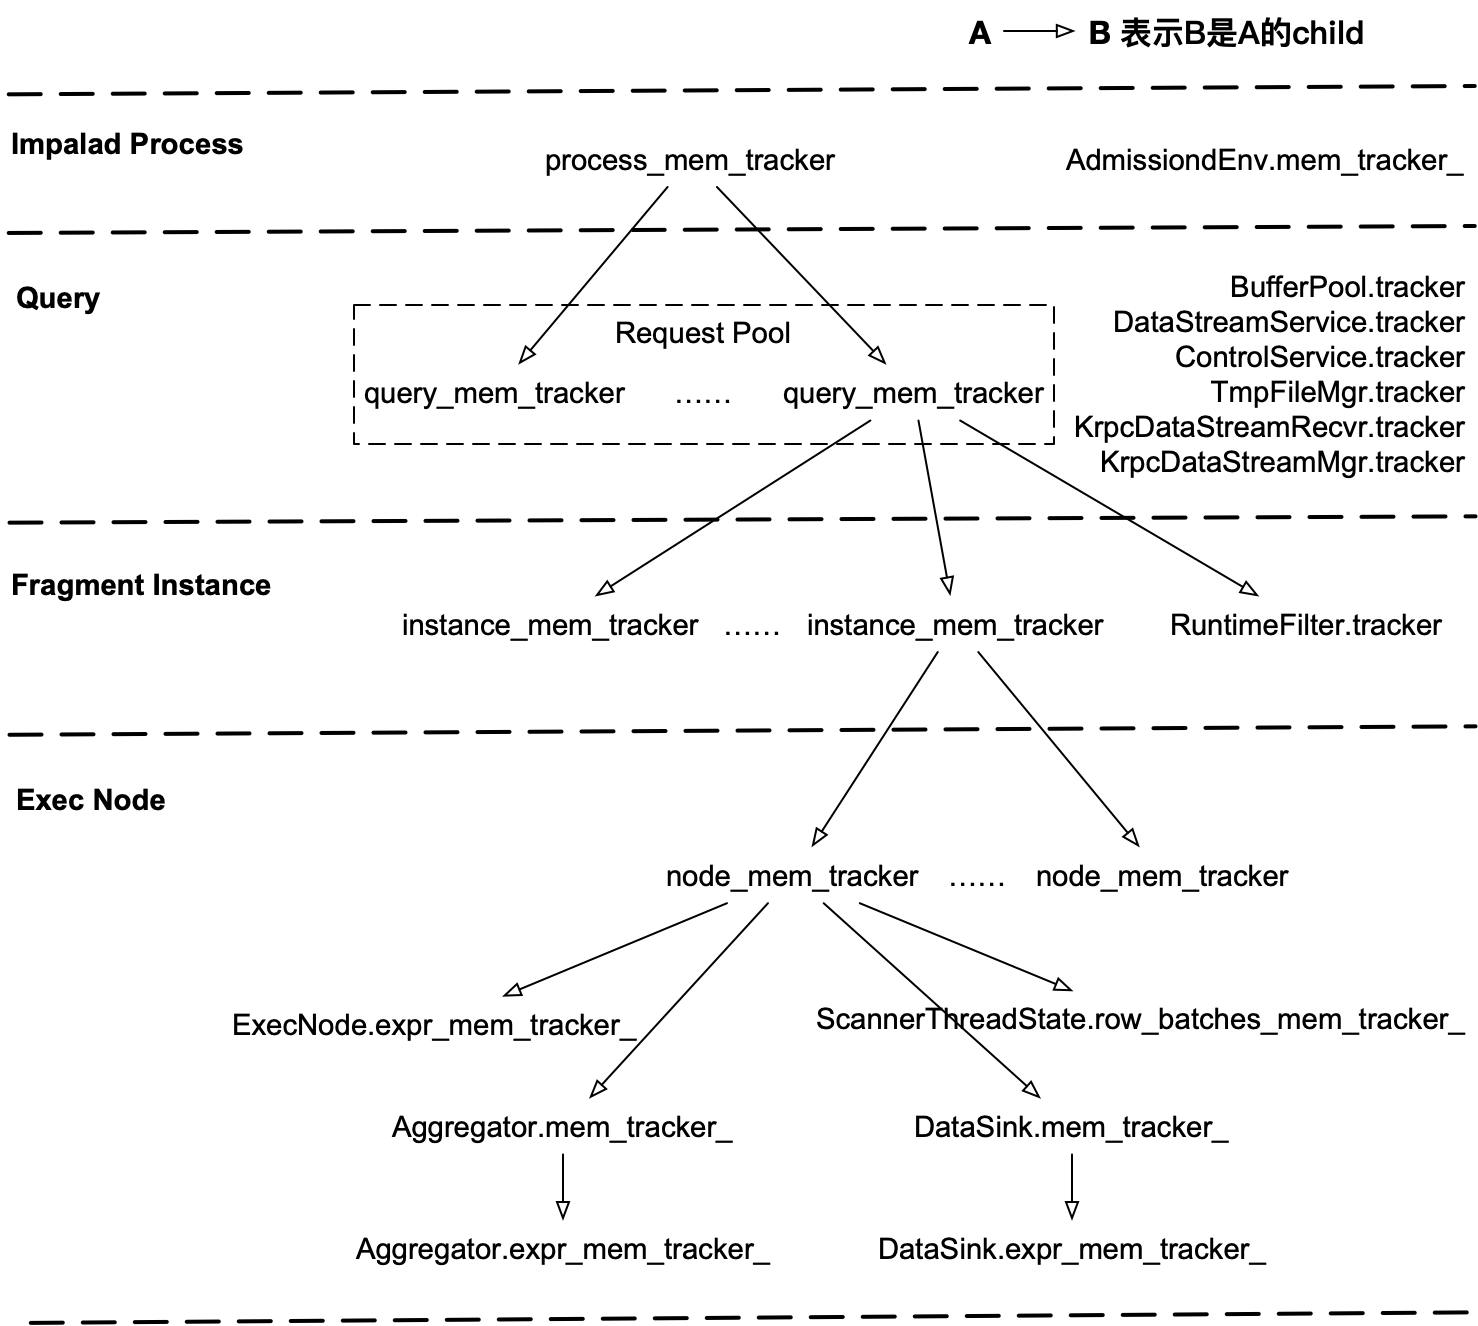
Impala's MemTracker is divided into a 5-layer tree structure from top to bottom, which are process, request pool, query, fragment instance, exec/sink/etc. node. Before large memory application or release, manually calculate the memory to be applied for Size and consume the MemTracker. When the mem limit is reached, the consumption fails, and the statistics of several layers of MemTracke are printed from top to bottom. https://shimo.im/docs/6qxjctpyDHJgPwtw
ClickHouse's MemTracker is divided into two layers: ThreadPoolTracker and ThreadTracker. ThreadPoolTracker counts the memory of a Query Pipeline execution thread pool, ThreadTracker counts the memory of a single thread and saves it in the Thread Local variable, and automatically consumes ThreadTracker in the overloaded JeMalloc new/delete method.
Based on tcmalloc mew/delete hook and TLS, all memory new/delete/malloc/free/etc. of the BE process can be automatically counted. Similar to ClickHouse overloading JeMalloc.
Different from Jemalloc, TCMalloc used by Doris does not support overloading new/delete. In order not to invade the source code of TCMalloc, MemTracker is automatically consumed in the Hook added after TCMalloc new/delete/malloc/free to track all memory usage of the process. Compared with the previous method of manually consume/release large memory in MemPool and other locations, theoretically it will not be missed.
Compared with overloading TCMalloc new/delete, which consumes MemTracker before the system actually allocates memory, Hook is called after the system allocates memory, so the memory usage cannot be accurately limited, and there is still the risk of OOM.
Two places will be missed:
Except for the independent memory allocator in mmap and third-party libraries, ensure that all consume/release are triggered by TCMalloc new/delete hook, thus ensuring that each memory request and release is tracked only once.
The same piece of memory should be consumed and released on the same tracker as much as possible to avoid inaccurate recording of the two trackers. However, in many scenarios, it is inevitable to apply and release memory in different locations of different threads.
When the tracker is destructed, the remaining statistics will not be released, because consume and release will recursively synchronize to its parent tracker. If the two trackers have a parent-child relationship, a piece of memory consumes on the child tracker and releases on the parent tracker. When the child tracker Destruction will cause repeated releases. as follows:

Before, exec_mem_limit was actually the memory limit at the Fragment Instance level, not the query. After, all Fragment Instance mem trackers of a query share a common ancestor query mem tracker, which will be a real memory limit for a query.
All threads involved in a query runtime should attach the query when the thread starts, and save the queryID, instanceID, query mem tracker, etc. to TLS (Thread Local Storage). If the limit is exceeded when consume query mem tracker in the new/delete hook , then cancel the query in the callback when the TLS mem tracker consume fails, replacing the previous method of manually judging whether the instance mem tracker has exceeded limit in the join/agg node and other loops. detach query when the thread exits.
This may cause some previously successful query ooms, which may require hint set exec_mem_limit to rewrite the query.
Schematic diagram of Tracker statistics from the start of the BE process to the completion of the first Scan:
In the front, all the memory of the process is recorded in the process mem tracker, and all the memory of the query is recorded in the query mem tracker, we want to separate out the memory usage of each operator from the Query/Load/StorageEngine mem tracker.
During an attach query of a thread, at each stage of query execution, switch the tracker of the current stage to TLS, the subsequent tcmalloc hook will consume the current tracker, and the current tracker may belong to an exec node/exprs/hash table/etc., Get more detailed memory statistics.
The statistical method of the cache is to transfer memory ownership between the client tracker and the cache tracker. For example, in the LruCache insert stage, the memory ownership is transferred from the held tracker to the LruCache tracker, and in the LruCache find stage, the transfer is reversed. In order to find all caches, a memory-staining detection mode like ASAN may be required to avoid memory leaks.
After refactoring MemTracker, mem tracker is clearly divided into process - query(task) pool - query(task) - fragment instance - exec node - exprs/hash table/etc. from top to bottom.
When creating a tracker, the current tracker in TLS is used as the parent by default, so the hierarchical relationship of mem tracker is equivalent to the hierarchical relationship of code, which avoids complicated mem tracker parameter passing.
Previously, if you wanted to record the memory consumption of a location in the specified mem tracker, you needed to pass the mem tracker as a parameter layer by layer, such as RowBatch, RowBlock, and MemPool, which looked messy. After that, you only need to attach query or switch mem tracker externally, and you can get this mem tracker from TLS at any location inside.
The structure of the previous MemTracker:
Structure of MemTracker after refactoring:

Other refactorings to the MemTracker implementation:
The logic to manually consume/release trackers for part of the memory is still retained, but these trackers are created as virtual trackers, and cosume/release will not sync to parent. It is independent of the recording of tcmalloc hook in the thread local tracker, so the same block of memory is recorded independently in these two trackers, which is only used to improve the observability of running details.
The non-virutal tracker is similar to the INFO log level, and the virutal tracker is similar to the DEBUG log level. The specific difference between the two:
To avoid lock contention for MemTrackers shared between threads, all memory usage of threads is recorded in the TLS MemTracker.
To avoid frequent consumption of MemTracker, consume MemTracker once after accumulating the size of multiple memory operations in TLS. The default minimum size of each consumption is 2M.
To avoid frequent changes of std::shared_ptr use count when switching TLS MemTrackers frequently, during an attach query, TLS caches all switched MemTrackers and uncommitted memory consumption. In the future, the mem tracker in TLS should be changed to a raw pointer to fundamentally solve this problem.
As of now, the new memory statistics framework will bring about a 1%-2% performance penalty.
step1: Refactor impl of MemTracker, and related use. (https://github.com/apache/incubator-doris/pull/8322)
step2: Hook TCMalloc new/delete automatically counts to MemTracker. (https://github.com/apache/incubator-doris/pull/8476)
step3: Switch TLS mem tracker to separate more detailed memory usage, part1. (https://github.com/apache/incubator-doris/pull/8605)
step4: Switch TLS mem tracker to separate more detailed memory usage, part2. (https://github.com/apache/incubator-doris/pull/8669)
step5: Fix accuracy of memory tracker in vectorization.