Current state: [One of "Under Discussion", "Accepted", "Rejected"]
Discussion thread: https://lists.apache.org/thread/mvcfhj12hpk00ov1rhkw1k5d811jk8pj
JIRA or Github Issue:
Released: <Doris Version>
Google Doc: <If the design in question is unclear or needs to be discussed and reviewed, a Google Doc can be used first to facilitate comments from others.>
Telemetry refers to data emitted from a system, about its behavior. The data can come in the form of Traces, Metrics, and Logs.
Discrete events actively recorded by users, the recorded information is generally unstructured text content, which can provide more detailed clues when users analyze and judge problems.
Metrics
The collected data with aggregated attributes is designed to show users the running status of a certain indicator in a certain period of time, so as to view some indicators and trends.
Traces
Record the entire life cycle of a request call Process, which includes information such as service invocation and processing time.
a . Trace refers to the call links of all services that an external request passes through. It can be understood as a tree structure composed of service calls, and each link is identified by a globally unique ID.
b. Span refers to a call within a service or between services, that is, a node in the Trace tree, and there is a parent-child relationship between Span nodes. Span mainly includes Span name, Span ID, parent span ID, Timestamp, Duration and other information.
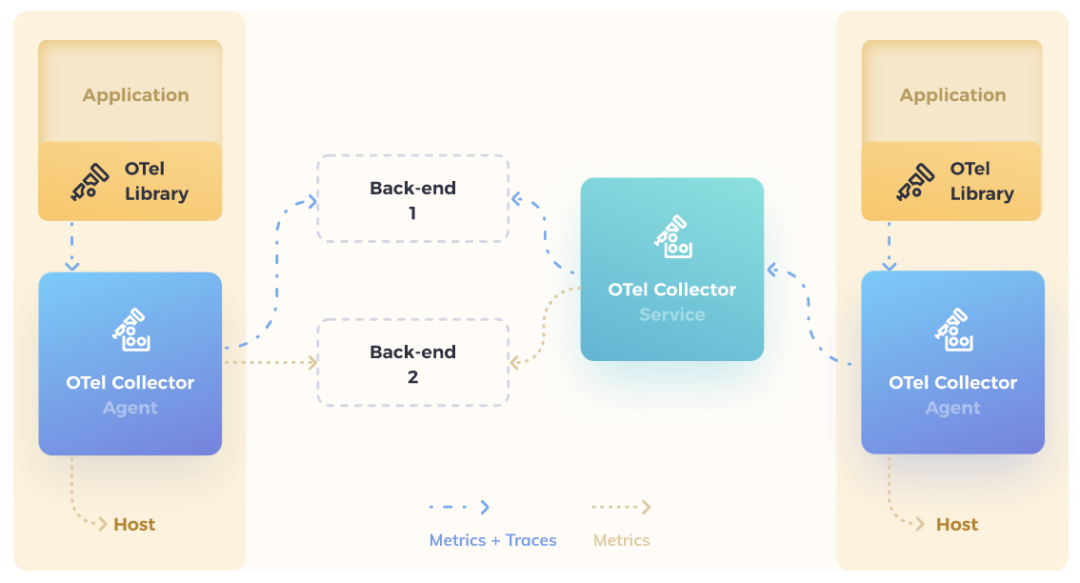
opentelemetry is responsible for the collection, processing and export of telemetry data, and Back-end is responsible for the presentation and storage of telemetry data. traces-related Back-end such as zipkin supports storage components: memory, Elasticsearch, MySQL, etc., and even doris can be used as its storage component.
This means that if trace data is stored in doris, that is, it allows users to have some trace analysis capability without deploying collector and back-end, and also to get full trace analysis processing capability after deploying collector and back-end.
The following diagram shows the export and storage process of trace, with arrows indicating the direction of trace data flow. trace can be collected and stored directly by doris, or by exporting trace to collector for processing and then storing it in doris, and back-end pulling data directly from doris.
┌──────────────────────────┐
│                          │
│  doris                   │
│                          │
│  ┌───────────────────┐   │           ┌───────────────────┐
│  │                   │   │           │                   │
│  │                   │   │           │                   │
│  │ trace collection  ├───┼───────────►  otel collector   │
│  │                   │   │           │                   │
│  │                   │   │           │                   │
│  └─────┬─────────────┘   │           └─────────┬─────────┘
│        │                 │                     │
│        │      ┌──────────┼─────────────────────┘
│        │      │          │
│        │      │          │
│  ┌─────▼──────▼──────┐   │           ┌───────────────────┐
│  │                   │   │           │                   │
│  │                   │   │           │                   │
│  │ trace storage     ├───┼───────────►    back-end       │
│  │                   │   │           │                   │
│  │                   │   │           │                   │
│  └───────────────────┘   │           └───────────────────┘
│                          │
│                          │
└──────────────────────────┘
trace is only created by fe, and when fe receives a sql request, it creates the root span and initializes the traceId in the processOnce method of the ConnectProcessor class. if fe does not have tracing enabled, be does not create traces either.
When fe launches an rpc to be, it creates a span of type client and injects the context of the span into the rpc. be parses the span context after receiving the rpc and creates a span of type server with the span as the parent span. trace propagation across processes is done in this way. By comparing the time of these two spans, we can get the network time consumed by the rpc call.
be creates span when receiving the rpc, executing the fragment, and buries the collection of span in the open, get_next, and close methods of all ExecNode. Since the get_next method of each ExecNode is called multiple times, to create too many unnecessary spans, the get_next method of the same ExecNode only creates a get_next_span the first time it is called, and ends the get_next_span after the last call. A span is also created in the scanner thread started by ScanNode to record the duration of the scan thread. In addition, much of the counter information in the profile is added to the span in the form of Attribute.
Exporting span is divided into 3 stages:
a. Support exporting span to back-end directly, such as zipkin.
b. Introduce otel collector, support exporting span to otel collector.
c. Support exporting span to doris.
specific implementation steps and approximate scheduling.