This feature was first introduced in Ambari 2.1.0 release. Any Ambari release before 2.1.0 does not support this feature. Cluster is required to be upgraded to Ambari 2.1.0 or above to use this feature.
This document assumes that the service metrics are being exposed via Ambari. If this is not the case then please refer to Metrics document for more related information. |
The term Enhanced Service Dashboard is used for being able to seamlessly add new widgets to the service summary page and heatmap page. This feature enables stack service to be packaged with the widget definitions in the JSON format. These widget definitions will appear as default widgets on the service summary page and heatmap page on service installation. In addition new widgets for the service can be created any time on the deployed cluster.
Displaying default service dashboard widgets on service installation is a 3 step process:
Widget gets the data to be charted from the service metrics. It is important to validate that the required service metrics are being exposed from Ambari metrics endpoint before defining a widget. |
Ambari supports 4 widget types:
A widget to display line or area graphs that are derived from one or more than one service metrics value over a range of time.

{
 "widget_name": "Memory Utilization",
 "description": "Percentage of total memory allocated to containers running in the cluster.",
 "widget_type": "GRAPH",
 "is_visible": true,
 "metrics": [
   {
     "name": "yarn.QueueMetrics.Queue=root.AllocatedMB",
     "metric_path": "metrics/yarn/Queue/root/AllocatedMB",
     "service_name": "YARN",
     "component_name": "RESOURCEMANAGER",
     "host_component_criteria": "host_components/HostRoles/ha_state=ACTIVE"
   },
   {
     "name": "yarn.QueueMetrics.Queue=root.AvailableMB",
     "metric_path": "metrics/yarn/Queue/root/AvailableMB",
     "service_name": "YARN",
     "component_name": "RESOURCEMANAGER",
     "host_component_criteria": "host_components/HostRoles/ha_state=ACTIVE"
   }
 ],
 "values": [
   {
     "name": "Memory Utilization",
     "value": "${(yarn.QueueMetrics.Queue=root.AllocatedMB / (yarn.QueueMetrics.Queue=root.AllocatedMB + yarn.QueueMetrics.Queue=root.AvailableMB)) * 100}"
   }
 ],
 "properties": {
   "display_unit": "%",
   "graph_type": "LINE",
   "time_range": "1"
 }
}
|
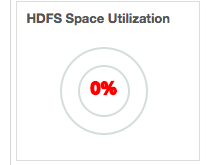
A widget to display percentage calculated from current value of a metric or current values of more than one metric.
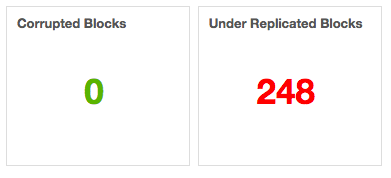
A widget to display a number optionally with a unit that can be calculated from the current value of a metric or current values of more than one metric.
A widget to display one or more numbers calculated from current value of a metric or current values of more than one metric along with the embedded string.
Aggregator function for the Metric
Aggregator function are related to only service component level metrics and are not supported for host component level metrics. |
Ambari Metrics System supports 4 type of aggregation:
By default Ambari Metrics System uses the average aggregator function while computing value for a service component metric but this behavior can be overridden by suffixing metric name with the aggregator function name (._max, ._min, ._avg and ._sum).
{
 "widget_name": "Blocked Updates",
 "description": "Number of milliseconds updates have been blocked so the memstore can be flushed.",
 "default_section_name": "HBASE_SUMMARY",
 "widget_type": "GRAPH",
 "is_visible": true,
 "metrics": [
   {
     "name": "regionserver.Server.updatesBlockedTime._sum",
     "metric_path": "metrics/hbase/regionserver/Server/updatesBlockedTime._sum",
     "service_name": "HBASE",
     "component_name": "HBASE_REGIONSERVER"
   }
 ],
 "values": [
   {
     "name": "Updates Blocked Time",
     "value": "${regionserver.Server.updatesBlockedTime._sum}"
   }
 ],
 "properties": {
   "display_unit": "ms",
   "graph_type": "LINE",
   "time_range": "1"
 }
}
|
A Service that has widgets.json and metrics.json file will also be provided with following abilities:
Widget Browser for performing widget related operations.
Create widget wizard for creating new desired service widgets in a cluster.
Edit widget wizard for editing service widgets post creation.
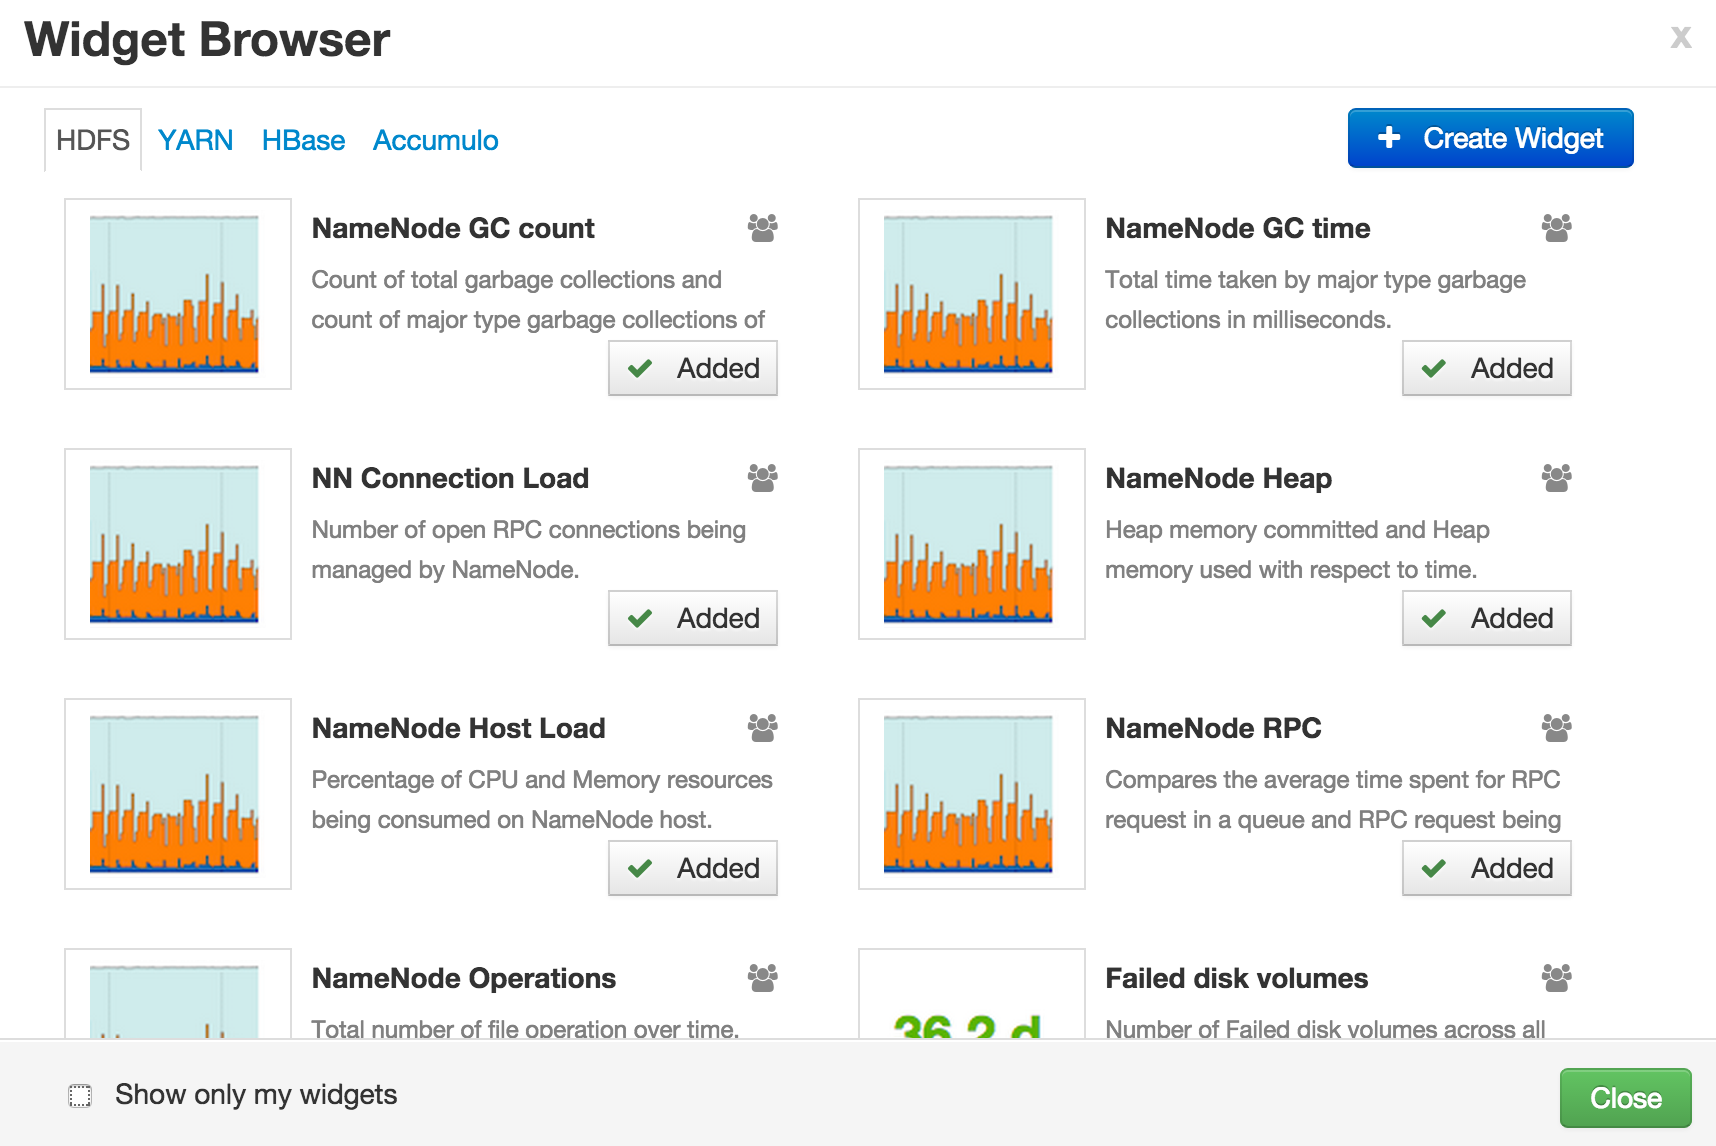
Widget Browser is the place from which actions can be performed on widgets like adding/removing a widget from the dashboard, sharing widget with other users and deleting a widget. While creating new widget, user can choose to share the widget with other users or not. All widgets that are created by the user + shared with the user + defined in the stack as default service widgets will be available in the widget browser of a user.
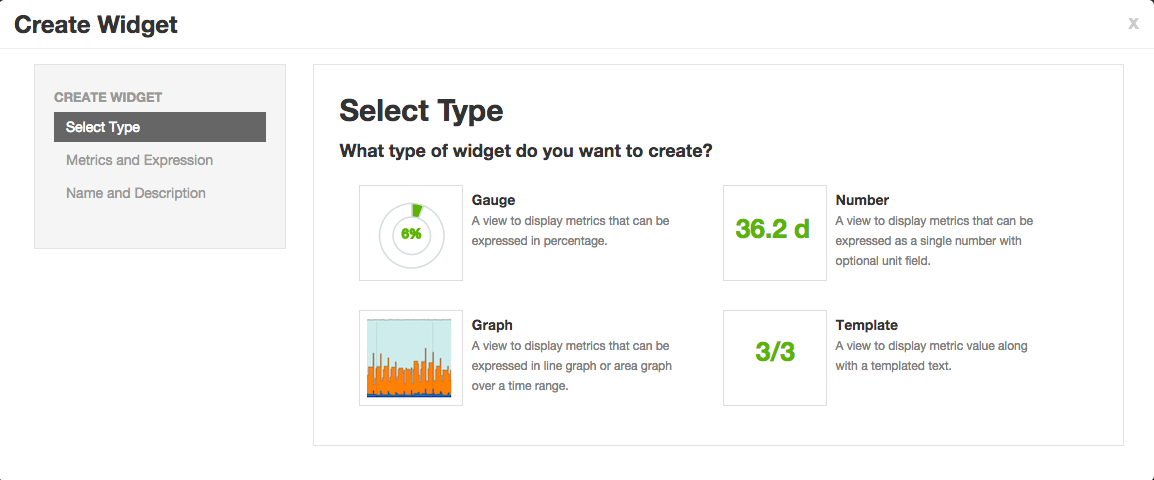
A custom desired widget can be created from the exposed service metrics using 3 step Create Widget wizard.
If the existing service in Ambari is pushing the metrics to Ambari metrics collector then minimal work needs to be done. This includes adding metrics.json and widgets.json file for the service, and might include making changes to metainfo.xml file.
AMBARI-9910 added widgets to Accumulo service page. This work can be referred as an example to use Enhanced Service Dashboard feature. |