Description
Zeppelin is a collaborative data analytics and visualization tool for distributed, general-purpose data processing systems such as Apache Spark and Apache Flink.
It has two main features:
- the data analytic phase
- the data visualization phase.
This project is an improvement or a re-design of the Data Visualization Component.
Zeppelin front-end web application already have rich visualization library based on D3, but is not made to allow other libraries and charts.
The goal of this Google Summer of Code project is to make the visualization module pluggable in order to benefit from the wide range of existing visualization libraries.
Mentors
Corneau Damien
BEZZUBOV Alexander
Student
UDANTHA Madhuka
JIRA Issues
| Original GSOC Issue | 
|
|---|
| Feature Issue |  |
|
|---|
Documentation
Issue Milestones

Milestone-1
Description
This Milestone is to study different charting libraries and understand how we can make a pluggable system.
Since this milestone works as some POC, the source code will be found in the student public repository
Ressources
Feature List
- Reading CSV files from d3
- Support three chart types
- Google Chart
- High Chart
- NVD3 Chart
- Drawing same chat (bar) from 3 charting libraries.
- car.csv file contains data set
- Switching chart types (bar and line)
Task List
- Update Milestone-1 in Zeppelin Wiki
- Milestone - PoC Web Application(does not depend on Zeppelin codebase as Spring restructuring)
- All charts read one CSV file
- Three different charting library (NVD3, Google Chart, High charts)
- Switching between Line and Barchart
- Must create a Pull Request to have conversation going
Results

Use case:
- User can pick charting library that he preferred
- User have to enter CSV file name. (no need to enter file extension)
- Then user have to load data for particular charting library or all the charting libraries
- Final he can pick chart type he need.
- User can switch the chart type (bar or line) and also the chatting library.

Milestone-2
Description
This Milestone an update of previous Milestone. Instead of making the scope bigger, it was decided that it would be more beneficial to work on code quality.
Since this milestone works as some POC, the source code will be found in the student public repository
Ressources
Feature List
- Improve the UI
- Adding grunt for project and build
- Adding Test
- Refactoring using controller pattern
- Separate the code in smaller functional entities
Task List
Change on UI:
- Have one loading button for each data set
- Make the Navbar .active state using angular
- Make the action steps and status easier to understand (order the steps, add explanations maybe, add css to selected options...)
Using Zeppelin Tools:
- Use grunt in the project (http://gruntjs.com/)
- Include and use lodash when possible (Resources are Followed)
Improving Code:
- Try to create reusable functions instead of duplicating code
- Chart Controller Improved on DRY - Separate the controller into smaller logical elements and files (controllers, services, factory...)
- Global Chart Factory have generic chart pattern and each chart library will have it is own factory
- Implement the controller pattern (https://github.com/johnpapa/angular-styleguide#controllers)
- Services
- Controllers (Factory model)
Testing:
Git Flow Process
- Make a PR from milestone-2 to milestone-1
Architecture Improvements
- Generic data model for all three chart types
- Global Chart Factory contains the Global chart model and it is extended by each charting factory.
- Use grunt
- grunt serve --> start the server
- grunt test --> run the test
- grunt build --> build the application
- Revamp code to "controller pattern"
- Implement a few tests
Style
- Handling PR with screen shoots and task items
- Use JS 'strict' mode (mainly in controllers)
- Avoid 'global' variables
- Coding style, follow Google JavaScript
Results
Project is using grunt so you can test application from grunt test (Few test cases are developed)
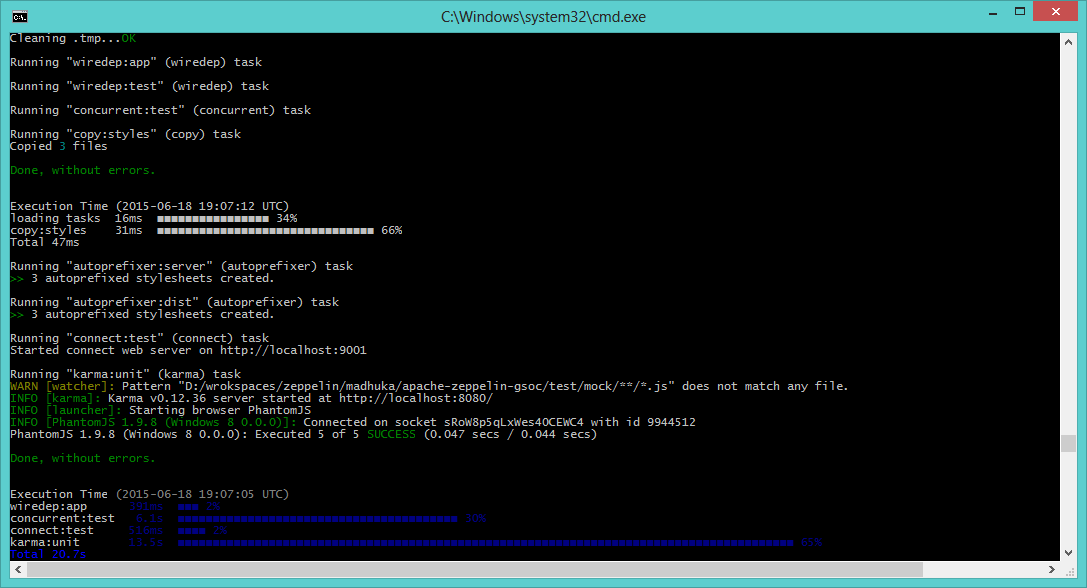
It contains industrial standard plugins for grunt (clean, wiredep, concurrent, karma. etc.). Grunt serve will start the server
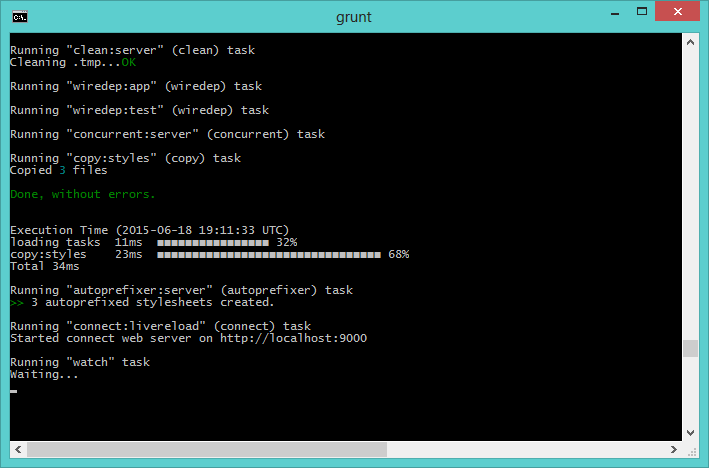
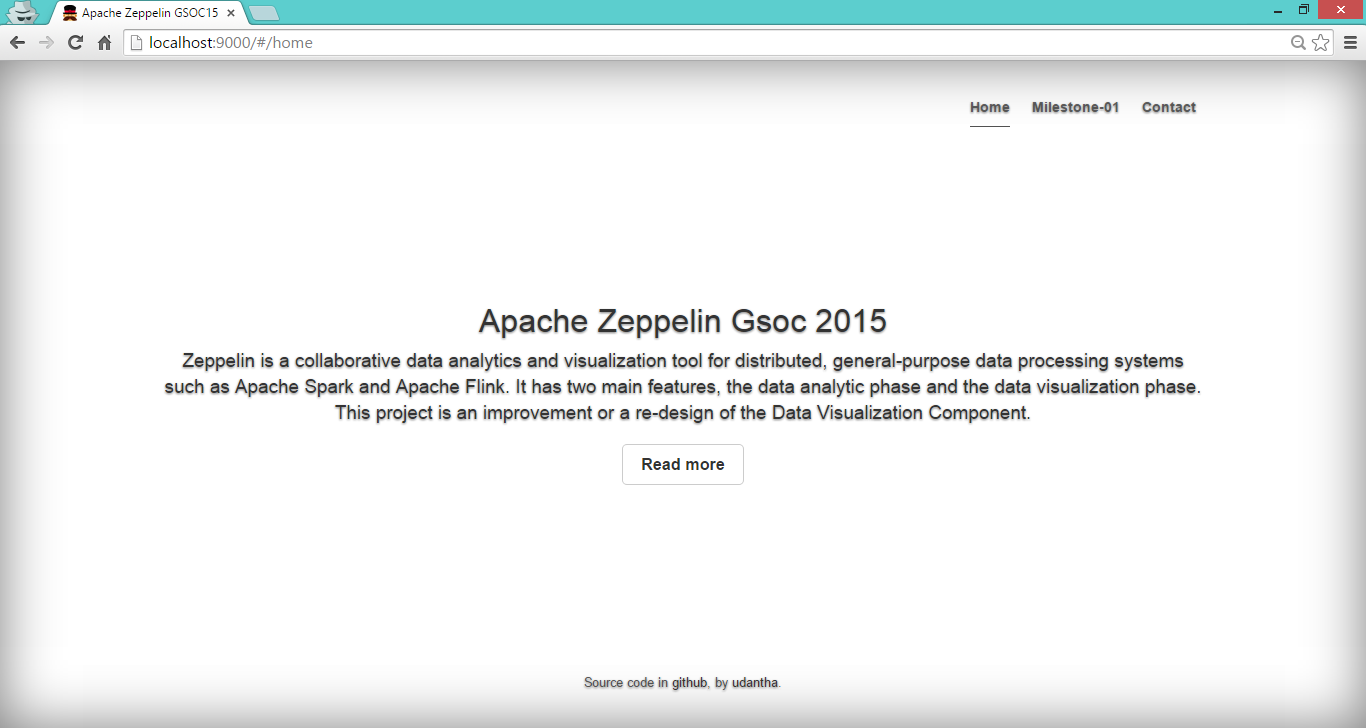
It will start app and open the home page as below
Now you can check milestone in the menu. You will have select the data set from click as button. Data set is store as csv file. D3 is used to read it.
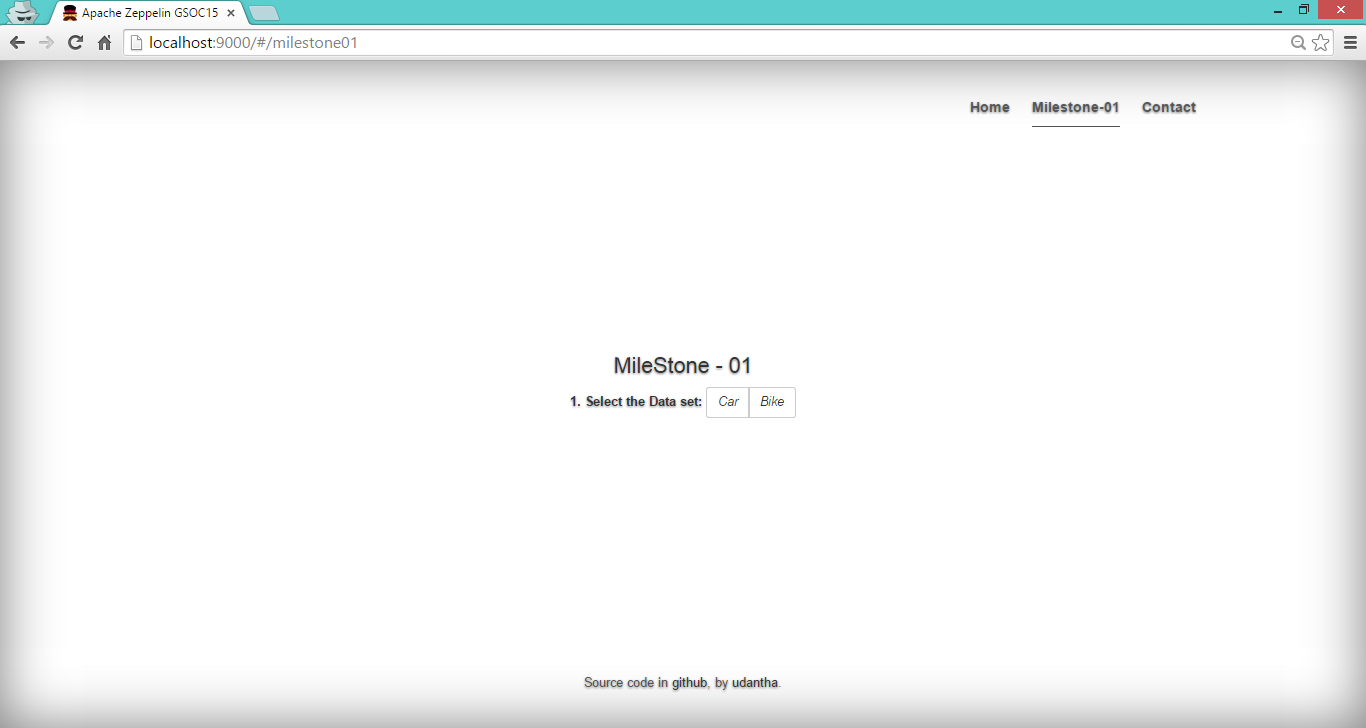
After you picked the 'Data Set' (Car or Bike), You can pick charting library then chart type as below

Each task is be explain in the Task list as well.