Introduction
In order to identify issues within CloudStack, a CloudStack admin would go through various resources such as zones/clusters/hosts/storage pool or with VMs or volumes, using a CLI or some other tool/script to find CPU/Memory/Disk/Network usage of that resource to figure out if that resource is exhausted, or having issues for example host is down, storage pool is full etc. The metrics view aims to solve that problem by showing metrics information for these resources which would allow hierarchical navigation to triage issue (for example, Zone -> Cluster -> Host -> Instances -> Volumes, Storage Pool -> Volumes), allow common operation (like quick view), mark threshold data (such as coloring a tabular cell for resources that have reached notification/disable threshold), allow data to be sorted and refreshed.
Bug Reference

Document History
| | |
|---|
1.0 | Rohit Yadav / ACS-dev community | 5/Nov/2015 |
| | | |
Use case
CloudStack Admin would view the current state of specific resources to make a deterministic approach on additional actions. For example, a specific host could be overloaded in terms of CPU/Memory within the cluster, based on the new view we propose, the admin/operator would migrate the guest vm to another host within a cluster – or do a cross cluster migration.
Feature Specifications
- Reusable Table Widget and JS component/framework:
- A horizontally and vertically scroll-able table (with horizontal/vertical scroll bars)
- Alternate row coloring of table rows
- Sortable columns
- Refresh button
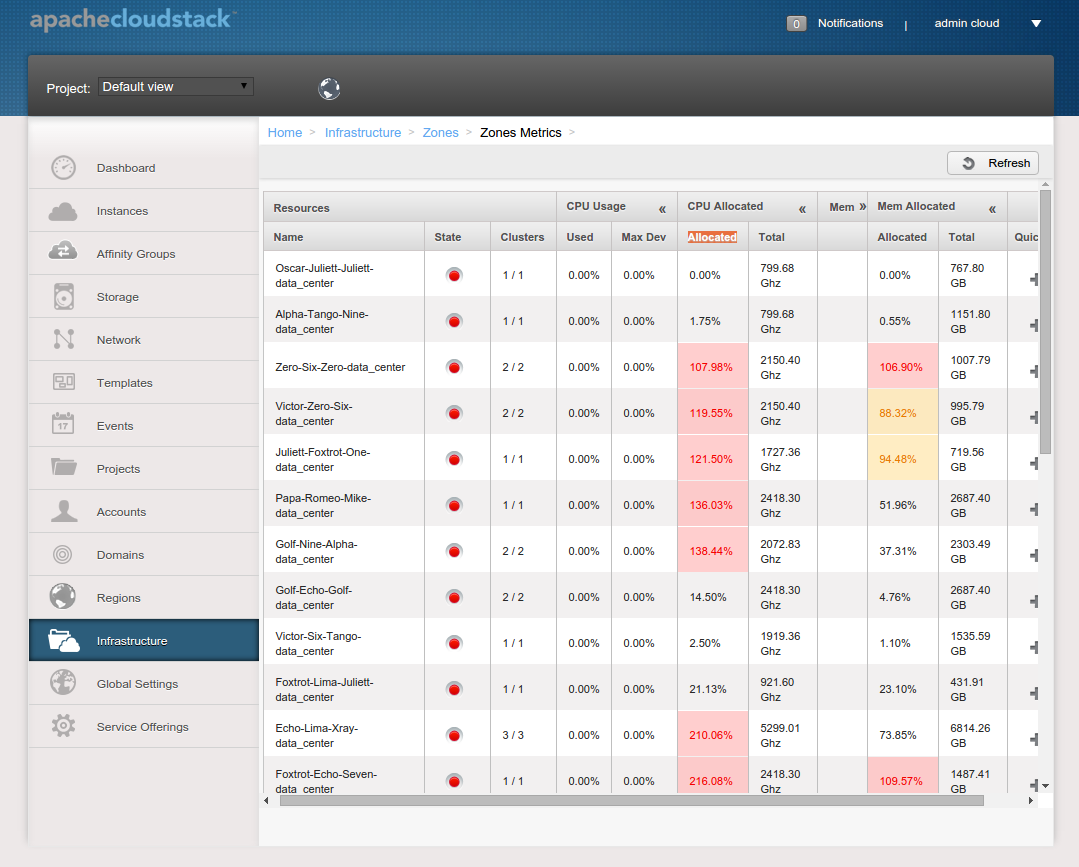
- Threshold table cell coloring (orange for those values exceed notification threshold, red for those resources that have exceeded disable thresholds)
- Collapsible column, grouping of columns into super column (for example, 3 sub columns in one column)
- Compact data: state icons (with tooltip instead of full text), lower minimum width
- Translatable labels
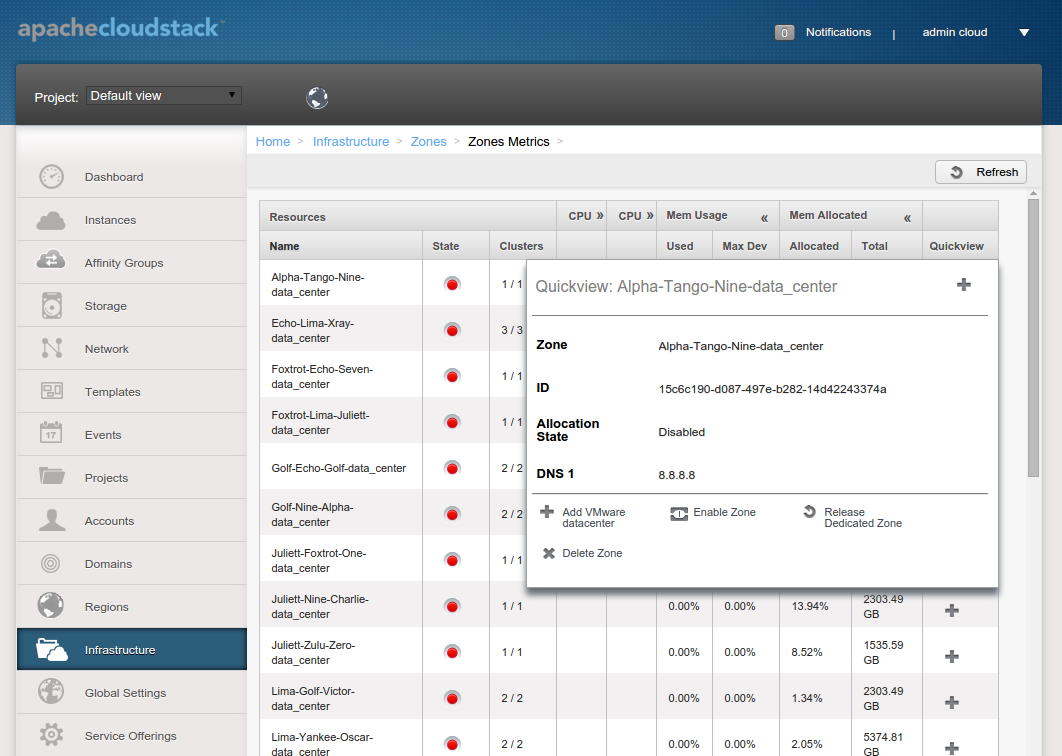
- Quick action or quick-view column, common operations in each metrics table
- Panel navigation from one view to other view with support to filter (for example, navigation from Zone -> Cluster, showing only clusters in the selected zone)
- Infinite scrolling to avoid blocking UI or failing on large API response
- Views for: Zones, Clusters, Hosts, Instances, Storage Pool and Volumes
- Navigation: Zone -> Cluster -> Host -> Instance -> Volumes -> Storage Pool, Storage Pool -> Volume
- Zone Metrics View:
- Fields: name, state, number of clusters, cpu usage (used, maximum deviation, allocated, total Ghz), memory usage (used, maximum deviation, allocated, total GB)
- Thresholds using global settings for notification and disable thresholds of cpu and memory
- Cluster Metrics View:
- Fields: name, state, number of hosts, cpu usage (used, max deviation, allocated, total Ghz), memory usage (used, maximum deviation, allocated, total GB)
- Thresholds using cluster level setting for notification/disable thresholds for cpu and memory
- Host Metrics View:
- Fields: name, state, cpu related (cores, total Ghz, used, allocated ghz), memory related (total, allocated, used), network (read/write GBs)
- Threshold based on cluster in which host belogs, for notification/disable thresholds for cpu and memory
- Instance Metrics View:
- Fields: name, state, cpu related (cores, total Ghz, used, allocated ghz), memory related (total, allocated, used), network (read/write mbs), disk (read/write mbs and iops)
- Storage Pool Metrics View: (Primary storage)
- Fields: Storage pool name, state, scope, type, disk related (used, total, allocated, unallocated)
- Thresholds: global and cluster level disk thresholds (disable and notification)
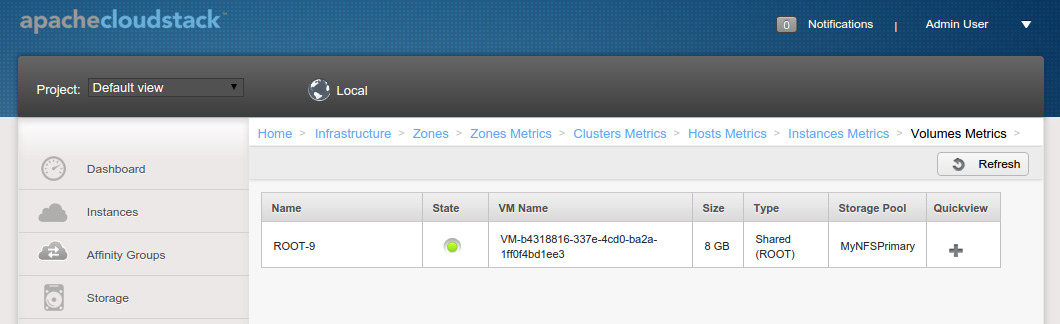
- Volume Metrics View:
- Fields: Volume name, VM name (if volume is attached), size, type (shared/local, root/data disk), storage pool name
- Sorting logic:
- Allow tables to be sorted alphabetically
- If data appears to be numeric, sort numerically
- If column/data is state, sort using the icon/label or title field
- If a column was previously sorted, infinite scrolling would add new rows and the UI should resort the data by the previously sorted column to result in the same sorted order
- If a column was previously sorted, refreshing metrics should result in the view being sorted by the previously sorted column
- Pagination size: allow users/admins to set a default page size for UI, by default.ui.page.size of at least 100. The current global pageSize value in UI is set to 20.
Implementation
- Framework and widget:
- Refactor listView.js to allow for such a general widget based on listView
- Implement a general JS module: metrics widget/framework with navigation, refresh and other common operations in metricsView.js
- Implement sorting in dataTable.js, allow sorting of all tabular data based on state, name (string values) or numbers (numeric data)
- Allow addition of metrics to any existing resource by adding a custom action on its listView such as:
viewMetrics: {
label: 'label.metrics',
isHeader: true,
addRow: false,
action: {
custom: cloudStack.uiCustom.metricsView({resource: 'resource'})
}
},
- Allow developers to declare listView fields defining options -- if the column has sub columns, thresholds or can be collapsed with following rules:
cpuallocated: {
label: 'label.metrics.cpu.allocated',
collapsible: true,
columns: {
cpuallocated: {
label: 'label.metrics.allocated',
thresholdcolor: true,
thresholds: {
notification: 'cpunotificationthreshold',
disable: 'cpudisablethreshold'
}
},
cputotal: {
label: 'label.metrics.cpu.total'
}
}
},
Allow developers to add navigation from one metrics view to other with following block in listView block:
browseBy: {
filterKey: 'storageid',
filterBy: 'id',
resource: 'storagepool'
},
In the above block, resource defines the next metrics view, filterBy defines the key in the API request used to render the next metrics view (?command=Api&key=value) where filterKey is the key from the table's row's json data which holds the value (uuid for example) that can be used in the next navigation call.
- Implement method to add/remove panels from the breadcrumbs to show navigation between metric views etc.
- Sorting limitations: Only the rows retrieved from the server are sorted client-side. For example, if a user sorted on the “Used” column on the Volumes Metrics View and information for all volumes has not yet been retrieved, it is possible that the first volume in the table will not be the largest or smallest. The CloudStack list APIs do not currently support requesting a server-side sort order. Additionally, metrics data is stored in memory – requiring the construction of an in-memory view or moving the storage the data to the database. This limitation will not be addressed as part of the feature. The global setting to set the page size is a short-term Band-Aid for the sorting issue.
- General Metrics View:
- Show metrics button in the main resource view:
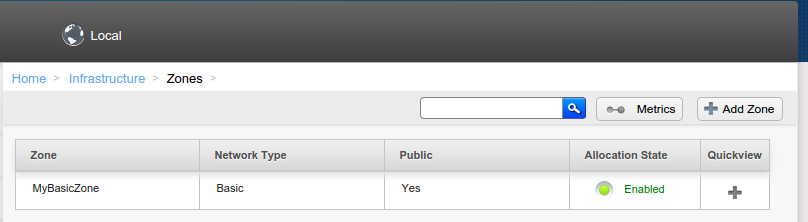
- General metrics view table/widget showing collapsible columns, quick view, refresh button, breadcrumb navigation, threshold coloring, sortable columns and compact state column:
- Quick-view column in action:
- Zone metrics view:
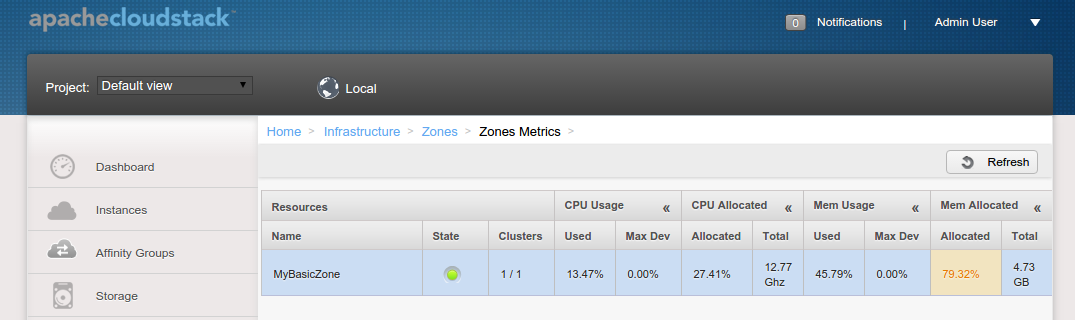
- Cluster metrics view:
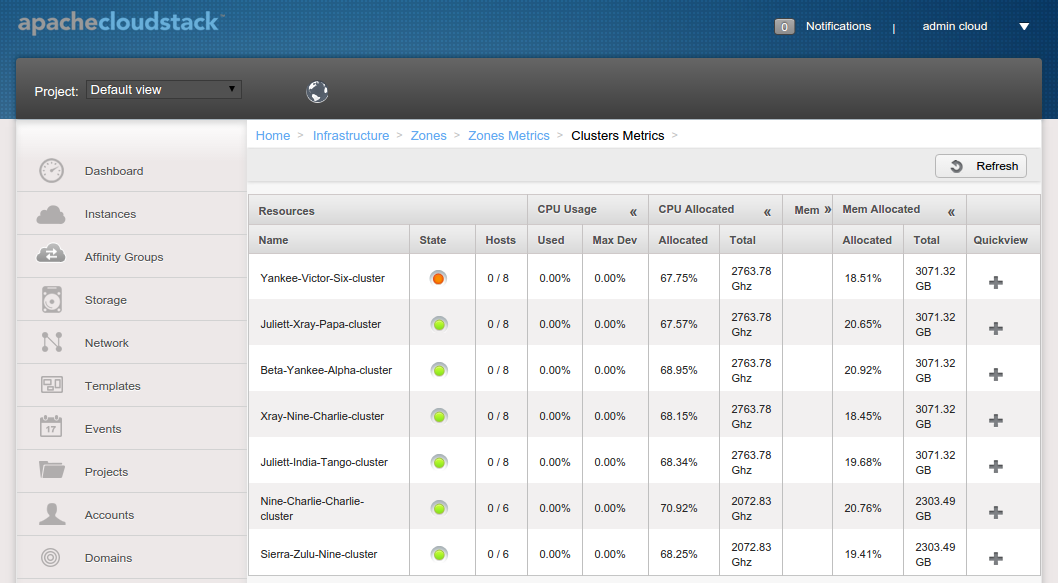
- Host metrics view:
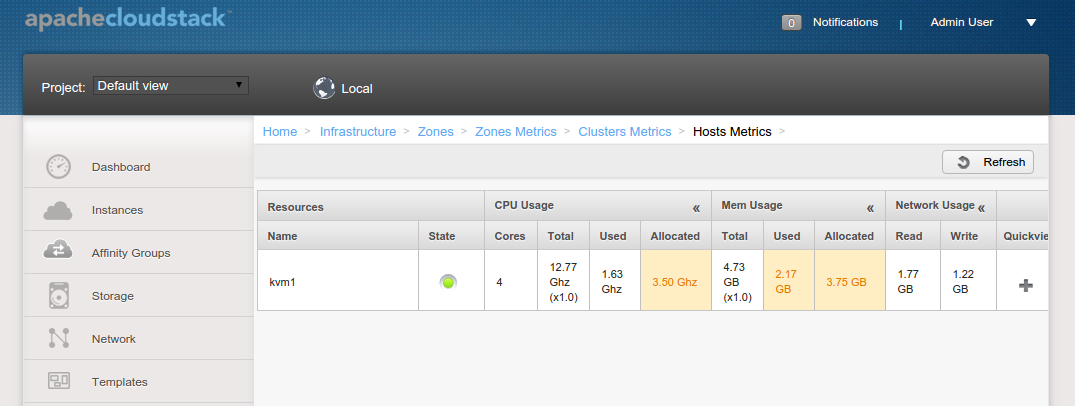
- Instance metrics view:
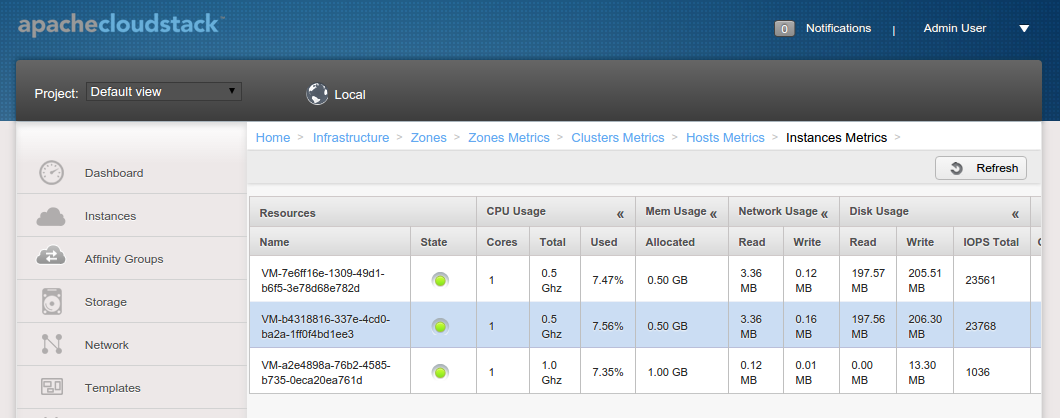
- Volume metrics view:
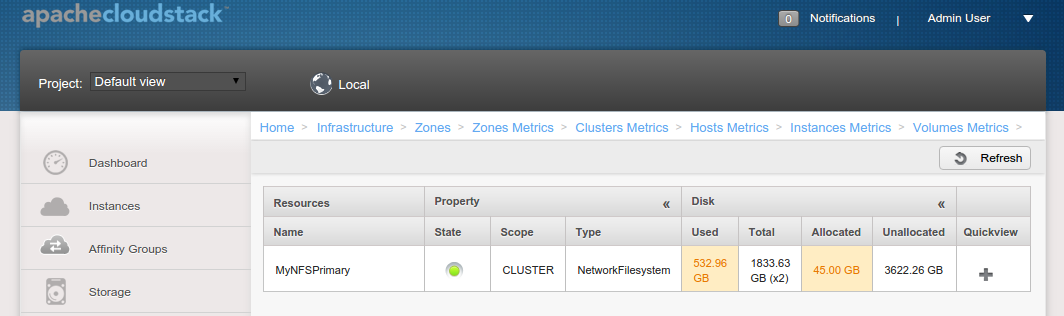
- Storage pool metrics view: