Metron Consists of the following modules:
| Module Name | Module Description | Current Version | Documentation Reference | Github Reference |
|---|---|---|---|---|
| metron-platform - metron-parsers | Topology for normalizing telemetry from native sensor formats to the Metron JSON | 0.1BETA | Streaming | https://github.com/apache/incubator-metron/tree/master/metron-streaming |
| metron-platform - metron-enrichment | Topology for enrichment of Metron JSON messages, cross referencing them against threat intel stores, and firing alerts | 0.1BETA | Streaming | https://github.com/apache/incubator-metron/tree/master/metron-streaming |
| metron-platform - metron-pcap | Topology for streaming network packets into HDFS for use with the PCAP Service | 0.1BETA | PCAP Topology | https://github.com/apache/incubator-metron/tree/master/metron-streaming |
| metron-platform - metron-api | Service for running analytics/filtering on the PCAP files in HDFS put there by the PCAP Topology | 0.1BETA | PCAP Service | https://github.com/apache/incubator-metron/tree/master/metron-streaming/Metron-Pcap_Service |
| metron-sensors | Sensors feeding Metron dashboards and analytics | 0.1BETA | Sensors | https://github.com/apache/incubator-metron/tree/master/metron-streaming/Metron-MessageParsers |
| metron-platform - metron-data-management | Loaders for bulk loading enrichment and threat intelligence stores | 0.1BETA | Data Loads | https://github.com/apache/incubator-metron/tree/master/metron-streaming/Metron-DataLoads |
| metron-ui | Metron SOC Analyst UI | 0.1BETA | UI | https://github.com/apache/incubator-metron/tree/master/metron-ui |
| metron-deployment | Scripts for automating Metron deployments | 0.1BETA | Deployment Scripts | https://github.com/apache/incubator-metron/tree/master/deployment |
In Metron, we have two domain specific languages which are used for filtering and simple data transformation:
The below diagram depicts the logical components of the Metron Platform.
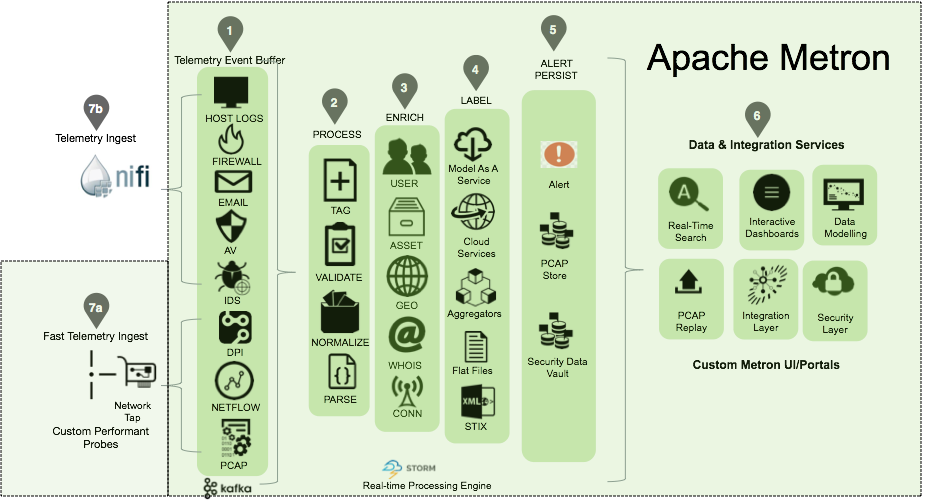
The below subsection traces an event as it flows through these different logical components.
All raw events from each telemetry security data source captured by Apache Nifi or custom Metron probe will be pushed into its own Kafka topic. The arrival of a telemetry event into the ingest buffer marks the start of where the Metron processing begins.
Each raw event will be parsed and normalized into a standardized flat JSON structure. Every event will be standardized into at least a 7-tuple JSON structure. This is done so the topology correlation engine further downstream can correlate messages from different topologies by these fields. The standard field names are as follows:
At this step, one can also validate the raw event and tag it with additional metadata which will be used by downstream processing.
After Step 3, the raw Bro event will look like the following:
 |
Once the raw security telemetry event has been parsed and normalized, the next step is to enrich different data elements of the normalized event. Examples of enrichment are GEO where an external IP address is enriched with GeoIP information (lat/long coordinates + City/State/Country) or HOST enrichment where an IP gets enriched with Host details (e.g: IP corresponds to Host X which is part of a web server farm for an e-commerce application).
After Step 4, the enriched Bro event will look something like the following:
 |
After enrichment, the telemetry event goes through the labeling process. Actions done within this phase include threat intel cross reference checks where elements within the telemetry event can be used to do look ups against threat intel feed data sources like Soltra produced Stix/Taxii feeds or other threat intel aggregator services. These threat intel services will then “label” the telemetry event with threat intel metadata when a hit occurs.
Other types of services include executing/scoring analytical models using model as a service pattern with the telemetry events that are flowing in (more details on Analytical Models/Packs and Model as Service patterns will be coming in upcoming blogs of this series).
After step 5 assuming the bro telemetry event had a threat intel hit, the message would look something like the following:
 |
During this phase, certain telemetry events can initiate alerts. These types of telemetry events are then indexed in an alert index store. A telemetry event can spawn an alert triggered by a number of factors including:
Also during this step, all enriched and labeled telemetry events are indexed and persisted in Hadoop for long term storage. The storage of these events in Hadoop produces a security data vault within the enterprise that enables next generation analytics to be performed.
After step 6, the telemetry event is stored in HDFS and indexed in Elastic/Solr based on configuration. The persisted event in HDFS looks something like the following:
 |
Steps 1 through 6 provide the mechanism to ingest, parse, normalize, enrich, label, index and store all security telemetry data across a diverse set of data sources in your enterprise into a single security data vault. This allows the Metron platform to provide a set of services for different types of security users to perform their jobs more effectively. Some of these services include:
For high volume network telemetry data like packet capture (PCAP), Netflow/YAF, and Bro/DPI, custom Metron probes will be available to ingest data directly from a network tap.
An example would be capturing Bro data using the custom C++ Metron probe. The raw Bro event captured by the Bro probe would look something like the following:
 |
For most security telemetry data sources that uses transports and protocols like file, syslog, REST, HTTP, custom API, etc., Metron will use Apache Nifi to ingest data at the source.
An example would be capturing data from a FireEye appliance with Nifi’s SysLog Processor. The raw Fireye event captured would look something like the following:
 |