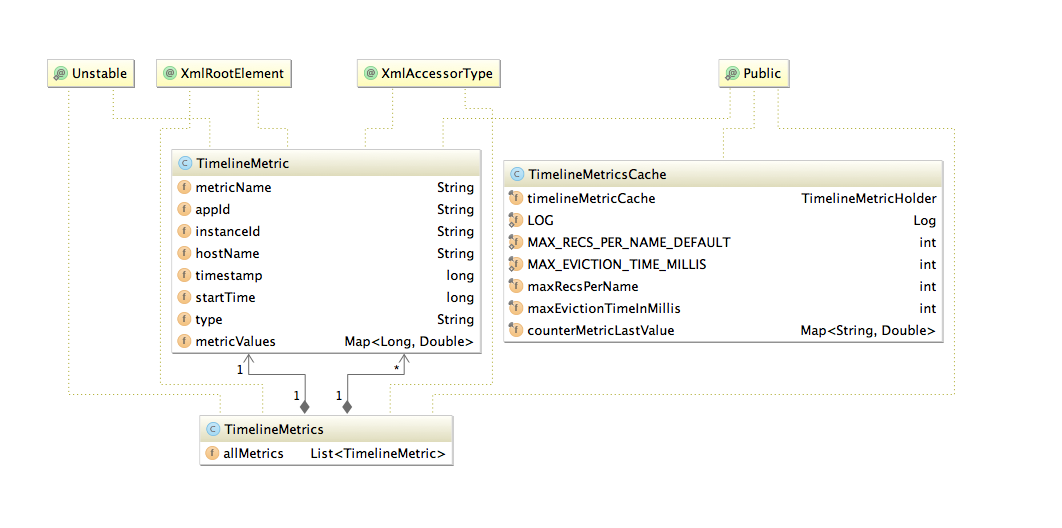
Source location for common data structures module: https://github.com/apache/ambari/tree/trunk/ambari-metrics/ambari-metrics-common/
Sending metrics to Ambari Metrics Service can be achieved through the following API call.
The Sink implementations responsible for sending metrics to AMS, buffer data for 1 minute before sending. TimelineMetricCache provides a simple cache implementation to achieve this behavior.
Sample sink implementation use by Hadoop daemons: https://github.com/apache/ambari/tree/trunk/ambari-metrics/ambari-metrics-hadoop-sink
POST http://<ambari-metrics-collector>:6188/ws/v1/timeline/metrics
{
  "metrics": [
    {
      "metricname": "AMBARI_METRICS.SmokeTest.FakeMetric",
      "appid": "amssmoketestfake",
      "hostname": "ambari20-5.c.pramod-thangali.internal",
      "timestamp": 1432075898000,
      "starttime": 1432075898000,
      "metrics": {
        "1432075898000": 0.963781711428,
        "1432075899000": 1432075898000
      }
    }
  ]
}
|
Connecting (POST) to <ambari-metrics-collector>:6188/ws/v1/timeline/metrics/
Http response: 200 OK
GET http://<ambari-metrics-collector>:6188/ws/v1/timeline/metrics?metricNames=AMBARI_METRICS.SmokeTest.FakeMetric&appId=amssmoketestfake&hostname=<hostname>&precision=seconds&startTime=1432075838000&endTime=1432075959000
Http response: 200 OK
Http data:
{"metrics": [ {"timestamp": 1432075898089, "metricname": "AMBARI_METRICS.SmokeTest.FakeMetric", "appid": "amssmoketestfake", "hostname": "ambari20-5.c.pramod-thangali.internal", "starttime": 1432075898000, "metrics": {"1432075898000": 0.963781711428, "1432075899000": 1432075898000 } } ] } |
The Metric Record Key data structure is described below:
Property | Type | Comment | Optional |
|---|---|---|---|
Metric Name | String | First key part, important consideration while querying from HFile storage | N |
Hostname | String | Second key part | N |
Server time | Long | Timestamp on server when first metric write request was received | N |
Application Id | String | Uniquely identify service | N |
Instance Id | String | Second key part to identify instance/ component | Y |
Start time | Long | Start of the timeseries data |
Precision query parameter
&precision=[ seconds, minutes, hours, days ]
All API calls honor a query limit set in the Collector service configs.
Query Time range | Resolution of returned metrics | Comments |
|---|---|---|
Last 1 hour | 30-60 sec resolution | Precision data available on demand as well |
Last 10 hours | 30-60 sec resolution | Honor query result limit |
Last 24 hours | 1 min aggregates | min and seconds precision available if requested |
Last week | 1 hour aggregates | |
| Last month | 1 hour aggregates | |
Last year | Daily aggregates | If query limit is reached query weekly aggregates |