DUE TO SPAM, SIGN-UP IS DISABLED. Goto Selfserve wiki signup and request an account.
What is it?
An external, end-to-end view about the performance of ozone views. As an example:
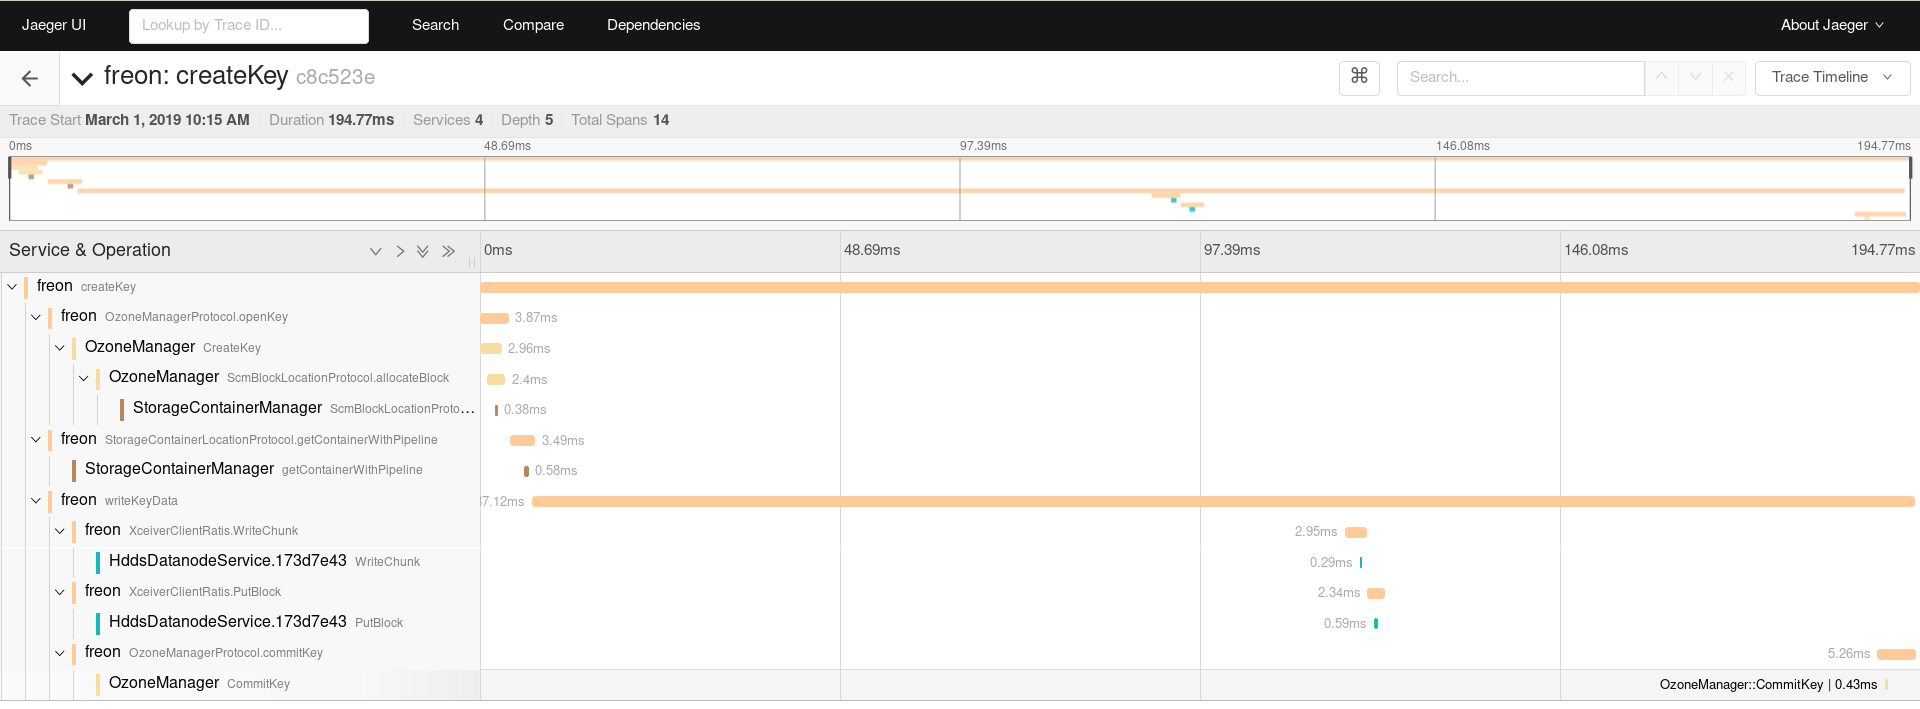
With tracing you can identify the slow components during an end-to-end test and go forward with Java Profiler on the identified component.
Getting started
(1) start the cluster from compose/ozonetrace (docker-compose up -d)
cd compose/ozonetrace
docker-compose up -d
docker-compose scale datanode=3
(2) start a simple freon test
docker-compose exec scm ozone freon rk --numOfKeys=10 --numOfBuckets=10 --numOfVolumes=10 --factor=THREE --replicationType=RATIS
(3) Check the output of the tracing. Open http://localhost:16686/search in your broser
How to use it in my own cluster.
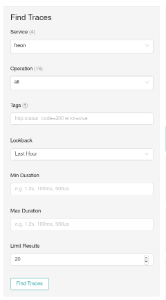
(4) Select freon service and click to the Find Tracing.
(5) Click to any of the results on the right hand side:
The first line represents the full time. Under the first line you can see the time of specific subsystems. The first (bigger) name in the line is the name of the component. The second one is the name of the trace (usually a method name)
How to use it in my own environment
(1) You need a jaeger server, running in your cluster. The easiest way to run it is using docker:
 dockerr run -d \
    -e COLLECTOR_ZIPKIN_HTTP_PORT=9411 \
    -p5775:5775/udp -p6831:6831/udp -p6832:6832/udp \
    -p5778:5778 -p16686:16686 -p14268:14268 -p9411:9411 \
  jaegertracing/all-in-one:latest
(2) Set the server endpoint and tracing frequency via environment variables.
JAEGER_AGENT_HOST=jaeger
JAEGER_SAMPLER_TYPE=const
JAEGER_SAMPLER_PARAM=1
This will send all the traces. For getting better performance it could be better to use a probability sampler.
JAEGER_SAMPLER_TYPE=probabilistic
JAEGER_SAMPLER_PARAM=0.1
"Probabilistic sampler makes a random sampling decision with the probability of sampling equal to the value of JAEGER_SAMPLER_PARAM environment variable. For example, with JAEGER_SAMPLER_PARAM=0.1 approximately 1 in 10 traces will be sampled."
See the docs about more samplers.
How does it work?
From high level, the tracing is very simple. We need to initialize a tracing context which contains a unique identifier. This identifier is stored in a global ThreadLocal variable. The identifier should be propagated over the wire or in case of thread separations. The tracing library can report the identifer from various points in the code and can create sub-identifier to show hierarchical results.
What should I do in the code?
We use OpenTracing which is a lightweight interface to do the tracing in a vendor independent way. Jaeger related API is only used to initialize the tracer, we use pure OpenTracing everywhere else.
We have a few helper classes the most important one is org.apache.hadoop.hdds.tracing.TracingUtil.
Init method
In each component we need to initialize the tracing. This is already done in most of the components. For example:
public static void main(String[] argv) throws IOException {
  if (DFSUtil.parseHelpArgument(argv, USAGE, System.out, true)) {
    System.exit(0);
  }
  try {
    TracingUtil.initTracing("StorageContainerManager");
    OzoneConfiguration conf = new OzoneConfiguration();
    ...
Dynamic method
The simplest and best way to add additional tracing information. Let's say you have a Java instance which implements ClientProtocol. To start a new tracing span (record specific timing information) for all the methods, you can create a dynamic proxy:
ClientProtocol protocol = TracingUtil.createProxy(originalClientProtocolInstance, ClientProtocol.class);
We do it for all the RPC clients as we would like overall time in a specific components:
ScmBlockLocationProtocolClientSideTranslatorPB scmBlockLocationClient =
    new ScmBlockLocationProtocolClientSideTranslatorPB(
        RPC.getProxy(ScmBlockLocationProtocolPB.class, scmVersion,
            scmBlockAddress, UserGroupInformation.getCurrentUser(), conf,
            NetUtils.getDefaultSocketFactory(conf),
            Client.getRpcTimeout(conf)));

return TracingUtil
    .createProxy(scmBlockLocationClient, ScmBlockLocationProtocol.class);
Manual method
Dynamic method is always better, as we can introduce sophisticated configuration to turn on/off the tracing inside the TracingUtil.createProxy call. But you can open a sub measurement (tracing span) at any time with using pure OpenTracing API:
try (Scope writeScope = GlobalTracer.get()
    .buildSpan("writeKeyData")
    .startActive(true)) {
  os.write(keyValue);
  os.write(randomValue);
  os.close();
}
Here we created a specific writeKeyData span (inside a Freon test). startActive(true) enables the newly created span and will close it at the end of the try block.
See the OpenTracing docs for more details.
Propagation