THIS IS A TEST INSTANCE. ALL YOUR CHANGES WILL BE LOST!!!!
This page is meant as a template for writing a KIP. To create a KIP choose Tools->Copy on this page and modify with your content and replace the heading with the next KIP number and a description of your issue. Replace anything in italics with your own description.
Status
Current state: Draft
Discussion thread: here [Change the link from the KIP proposal email archive to your own email thread]
JIRA: KAFKA-7722
Please keep the discussion on the mailing list rather than commenting on the wiki (wiki discussions get unwieldy fast).
Motivation
The ProducerPerformance tool is the standard for benchmarking Kafka producer send performance. The tool uses sampling and Java’s System.currentTimeMillis() to record latencies and provide percentiles at the end of each run. This method works well in most cases but results in a lack of precision.
This is a problem in low-latency environments in which sending a message takes at most a couple milliseconds. For example, if a user wants to run a benchmark test comparing two different Kafka cluster setups, it is hard to compare results if low latency values are observed.
Example Scenario:
Benchmark #1: average latency = 2 ms
Benchmark #2: average latency = 3 ms
Since System.currentTimeMillis() gives values with millisecond precision:
- A result of 2 ms can have a true value between [1.5, 2.5) before rounding
- A result of 3 ms can have a true value between [2.5, 3.5) before rounding
If we want to calculate the increase in latency observed, then we have a big spread of either:
- (1) Smallest spread: 2.5 - (2.5) or ~0, resulting in approximately ~0% increase in latency
- (2) Largest spread: (3.5) - 1.5 or ~2, resulting in approximately 2/2 or ~100% increase in latency
This means we cannot effectively compare these two benchmark results as the latency in #2 is anywhere from 0 to 100% higher than in #1, which is a big spread and results in very different implications.
To achieve a higher precision to handle low-latency environments better, we can use Java’s System.nanoTime().
Proposed Changes
This KIP proposes using nanoTime() to record latencies to provide higher precision.
Latency will be recorded in microseconds by truncating the result of calling nanoTime() by 3 digits.
long startTimeUs = System.nanoTime() / 1000;     // value in microseconds
// Send message…
// Message sent and callback called…
long latency = System.nanoTime() / 1000 - startTimeUs;     // value in microseconds
The code change required in this KIP is rather small, but this small change has a few considerations to discuss and address.
Considerations
Consideration #1: How Much Precision?
The first question to answer is how much precision do we need?
Since ProducerPerformance currently uses millisecond precision, we will determine the spread using values close to 1.0.
The examples below use two numbers that differ by only 1 in the least significant digit (last/right digit). Bracket denotes inclusive, and parenthesis denotes exclusive.
NOTE: When calculating the spread using numbers with a larger difference, you will observe a higher minimum spread (will not be zero).
Using scale = 1 (1 decimal place)
If we record a latency of 1.1 ms for the first run, and 1.2 ms in the second run, then the true values are:
- 1.1 = [1.05, 1.15)
- 1.2 = [1.15, 1.25)
Min spread: 1.15 - (1.15) = ~0
Max spread: (1.25) - 1.05 = ~0.2
Conclusion: Benchmark 2 is 0 to 20% slower than benchmark 1.
Using scale = 2 (2 decimal places)
If we record a latency of 1.01 ms for the first run, and 1.02 ms in the second run, then the true values are:
- 1.01 = [1.005, 1.015)
- 1.02 = [1.015, 1.025)
Min spread: 1.015 - (1.015) = ~0
Max spread: (1.025) - 1.005 = ~0.02
Conclusion: Benchmark 2 is 0 to 2% slower than benchmark 1.
Using scale = 3 (3 decimal places)
If we record a latency of 1.001 ms for the first run, and 1.002 ms in the second run, then the true values are:
- 1.001 = [1.0005, 1.0015)
- 1.002 = [1.0015, 1.0025)
Min spread: 1.0015 - (1.0015) = ~0
Max spread: (1.0025) - 1.0005 = ~0.0020
Conclusion: Benchmark 2 is 0 to 0.2% slower than benchmark 1.
By using 3 decimal places in millisecond latency measurements, we are able to observe a ~0.2% spread in a low-latency environment dealing with latencies around 1 ms. 3 decimal places for milliseconds is equivalent to microseconds. This 0.2% spread is quite small, especially since other factors are likely to generate a larger variance.
Consideration #2: Long Overflow
It is important to look at potential overflow as we are saving latency in microseconds now, which means each value is multiplied by 1000 (1 millisecond is 1000 microseconds).
To calculate overall average latency, ProducerPerformance will save all observed latencies in a single `totalLatency` long variable.
We can run some calculations to observe how many record latencies can be stored in a Long based on different average latencies.
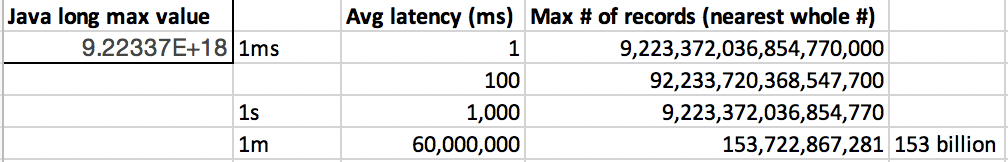
The chart above shows that if the average latency is 1 minute, then a Long can hold 153 billion records (latencies). This covers most use cases.
Public Interfaces
This proposed change only impacts the output of the ProducerPerformance.java class by adding more precision.
Compatibility, Deprecation, and Migration Plan
This proposed change only impacts the output of the ProducerPerformance.java class by adding more precision.
Rejected Alternatives
1. Adding a "low-latency" option to enable recording measurements using System.nanoTime()