THIS IS A TEST INSTANCE. ALL YOUR CHANGES WILL BE LOST!!!!
Status
Current state: "Under Discussion"
JIRA: https://issues.apache.org/jira/browse/KAFKA-12713
Please keep the discussion on the mailing list rather than commenting on the wiki (wiki discussions get unwieldy fast).
Motivation
The produce latency is an important metric to monitor for the cluster performance. As we know, latency is the sum from those parts, RequestQueueTime, LocalTime, RemoteTime, ResponseSend/QueueTime, ThrottleTime, MessageConversionsTime. RemoteTime means the time spent in the purgatory.
In a fully loaded cluster, the time in RemoteTime is very significant part of produce latency.
However, the produce remoteTime is hard to troubleshoot. That is the time spent by the leader waiting for the follower to fetch the data and send back the confirmed watermark. It can be affected by 1. Network is congested, 2. Fetch processing itself is slow. 3. Something else.
Currently we don't have the correct metrics to tell which part is contributing to the high Produce RemoteTime. That is because, the reported fetch latency didn't reflect the true fetch latency because it sometimes needs to stay in purgatory and wait for replica.fetch.wait.max.ms when data is more than fetch.min.bytes. This greatly skewed the real latency number.
The limitation of the current metrics:
1. Fetcher rate
This reflects how frequently the follower sending fetch request to the leader.
Those are captured currently using fetcherStats.requestRate.mark() in processFetchRequest
However, the fetch rate becomes almost meaningless because, the fetch request might just wait in purgatory.
2. Fetch processing time.
Fetch TotalTime also include the RemoteTime, which is the time it is waiting for the requests.
For this KIP, we like to propose the fix to make the metrics to report the real latency.
It would be very helpful if we can also monitor the latency between each pair of brokers and detect any networking device grey failures. This KIP makes it possible to monitor any latency change between brokers.
Public Interfaces
Add waitTimeMs in FetchResponse, and bump the FetchResponse and FetchRequest protocol version.
FetchResponse => TransactionalId RequiredAcks Timeout [FetchableTopicResponse]
   ThrottleTimeMs => INT32
   WaitTimeMs => INT32  # Add a new field to record the request wait time in purgatory
   Timeout => INT32
   ErrorCode => INT16
   SessionId => INT32
   FetchableTopicResponse => [Name [FetchablePartitionResponse] PreferredReadReplica Records]
   ......
Proposed Changes
We like to propose to track the real end to end fetch latency with those changes:
- Add waitTimeMs in FetchResponse()
- In Kafka API handler (in handleFetchRequest() function), when creating FetchResponse(), set the waitTimeMs as the time spent in purgatory
- In Follower broker, in processFetchRequest(), it will track the latency of fetch request and minus the waitTimeMs from FetchResponse.
- In FetcherStats, we will add a new histogram to track this calculated "true" fetch latency.
- We can also extend that to consumer fetch latency metrics.
The following figure illustrates the real end-to-end fetch latency. The grey box between the red circles is the waitTime subtracted from the fetch latency.
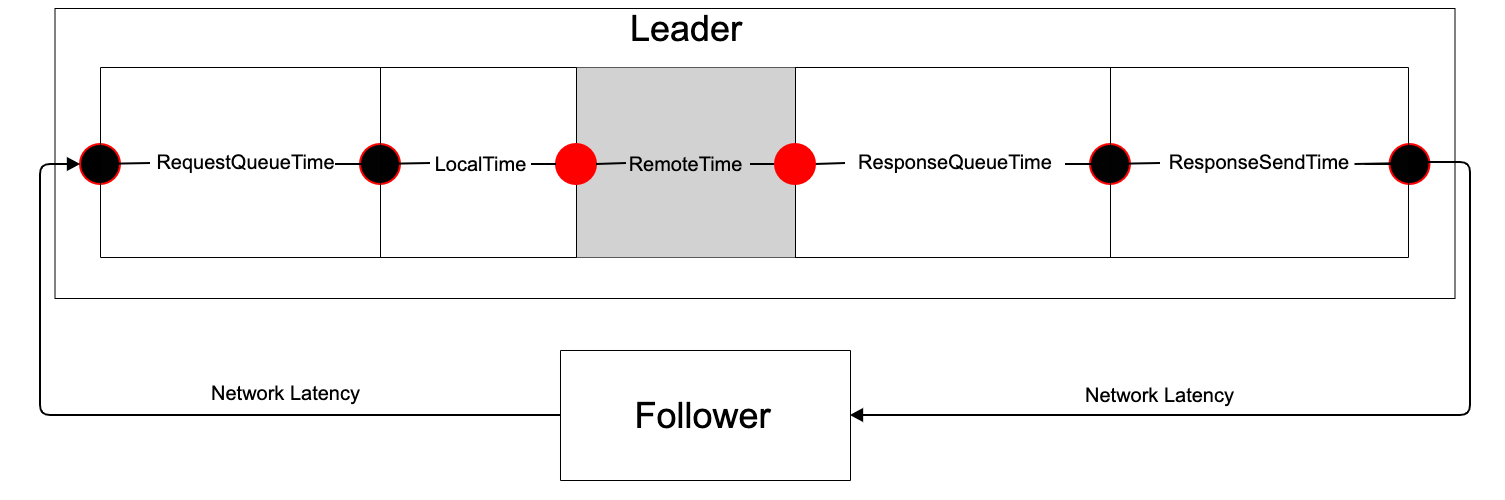
Additionally, at the leader side, we will add a new metric called TotalLocalTime, which is TotalLocalTime = TotalTime - RemoteTime. This metric measures the time spent to process the fetch request on leader side, excluding the time spent in the purgatory.
Example
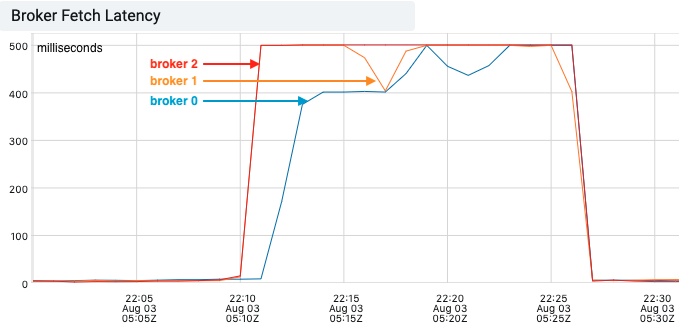
To better illustrate how the proposed fetch latency metric can be used for monitoring the latency between each pair of brokers, we simulated network latency by introducing artificial delays to the incoming packets on one broker(broker 0) of a 3-node cluster.
As the following graph shows, the broker fetch latency increased on all three brokers, pegging at 500ms(replica.fetch.wait.max.ms). This gave us very little information on where the slowness was introduced.
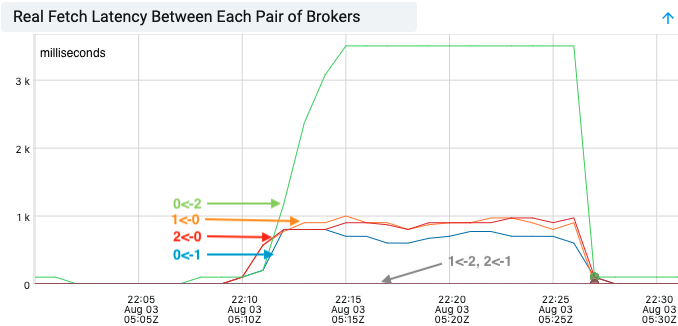
With the real end-to-end fetch latency, we can easily identify some slowness between broker 0 and broker 1, 2, but not between broker 1 and 2. This indicated broker 0 was the culprit.
Compatibility, Deprecation, and Migration Plan
Follow the standard protocol change update.
Rejected Alternatives
- End-to-end fetch latency including wait time
- Alternatively, we can track the end-to-end fetch latency at follower side, including the wait time spent in leader’s purgatory. This will avoid the protocol change in the FetchResponse. It is useful if the fetch latency is much greater than the replica.fetch.wait.max.ms. However, when the end-to-end fetch latency is close to replica.fetch.wait.max.ms, the time a fetch request stays in purgatory will skew the end-to-end fetch latency. It will be difficult to tell whether the high fetch latency is due to waiting or other reasons (slow networking, slow fetch processing).
- External Monitoring
- We do not add those metrics and instead use an external tool/process to monitor the network RTT between each pair of brokers. There are many tools for diagnosing network latency. However, most tools measure RTT by sending synthetic data packets between servers, which may not reflect the actual end-to-end fetch request latency.