DUE TO SPAM, SIGN-UP IS DISABLED. Goto Selfserve wiki signup and request an account.

...
The goal of this Google Summer of Code project is to make the visualization module pluggable in order to benefit from the wide range of existing visualization libraries.
Mentors
Corneau DamienUnknown User (corneadoug)
Student
JIRA Issues
...
|
|---|
...
Anchor milestone1 milestone1
...
- Update Milestone-1 in Zeppelin Wiki
- Milestone - PoC Web Application(does not depend on Zeppelin codebase as Spring restructuring)
- All charts read one CSV file
- Three different charting library (NVD3, Google Chart, High charts)
- Switching between Line and Barchart
- Must create a Pull Request to have conversation going
Results
Use case:
- User can pick charting library that he preferred
- User have to enter CSV file name. (no need to enter file extension)
- Then user have to load data for particular charting library or all the charting libraries
- Final he can pick chart type he need.
- User can switch the chart type (bar or line) and also the chatting library.
...
|
|---|
Feature List
- Make library and charts pluggable (Remove hard coded code, and simulate loading libraries)
- Fixes and code improvement
- Bigger Test Cover
- Scenario Tests
- Remove unused files
...
- No button style (just text) when we run grunt serve
- Need similar width for all charts (NVD3 is smaller than others for example)
- Need to have meaningful legends
Bugs:
- After selecting a dataset, then a chart library, it will draw the chart. However if you click again on the same chart type that the one shown, there won't be any data in the chart.
...
- Remove hard coded library names etc... from javascript code. Only an Array with Library Names should be used as configuration to refer to.
- Include the Chart Html only when needed (ng-include of a {{library}}.html file)
Fix a few bad things:
- Remove the dummy Data from chart factories
- loadData should not be inside of ChartCtrl
- Change hardcoded loadChartLibrary function parameter inside the HTML: loadChartLibrary(2) -> should be loadChartLibrary($index) or (chart.name)
Tests:
- Implement more tests, and change code if necessary
- Implement some scenario type of tests
Results
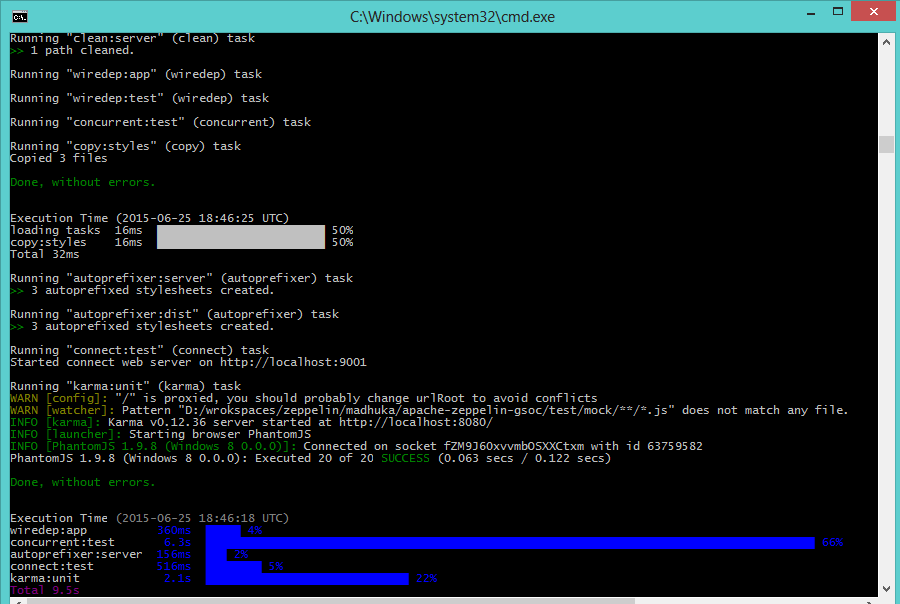
20 Test Cases are written 'grunt test'
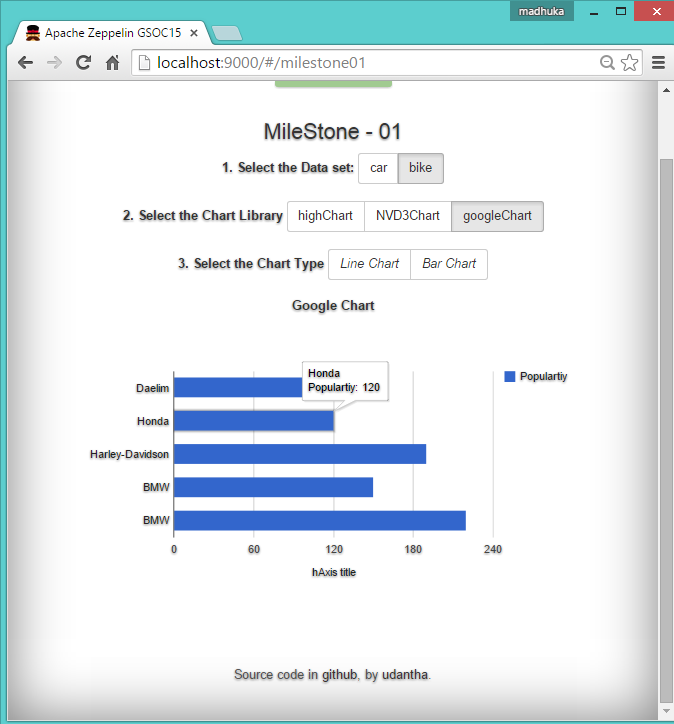
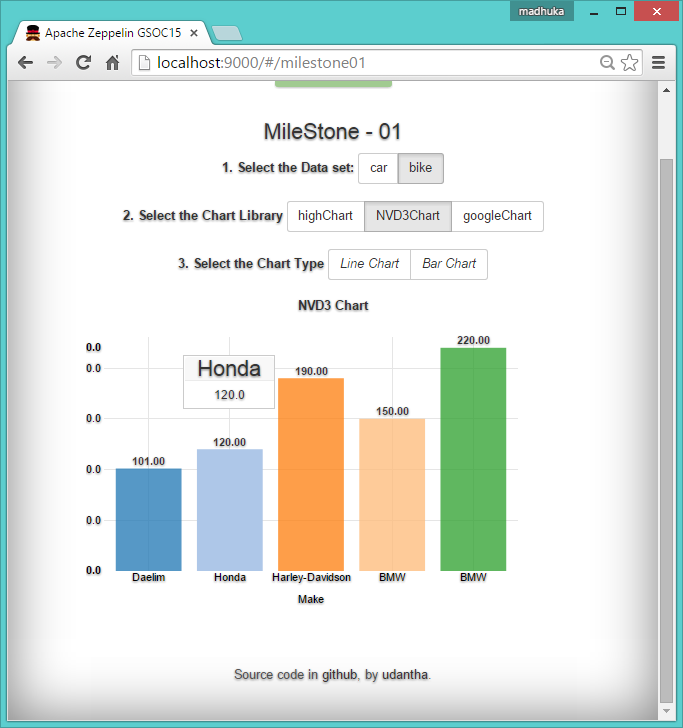
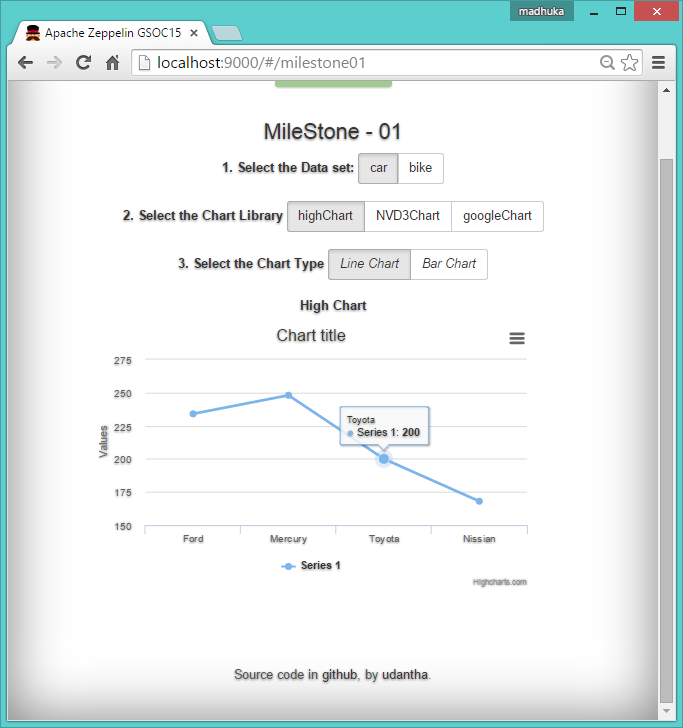
Updated UIs
URL:
http://madhuka.github.io/gh-pages-m3/#/milestone01
...
| Anchor | ||||
|---|---|---|---|---|
|
Milestone-4
Description
This is a temporary roadmap for milestone-4, the features might change in the future
Since Controller should work with any chart library and it should be abstracted. Therefore no library switches in Dev. Writing the steps how to add new chart type (such as pie chart) and steps to be followed for adding a new chart library to application are main task for documentation. Since this milestone works as some POC, the source code will be found in the student public repository
...
|
|---|
Feature List
Adding new chart type
- Writing the steps how to add new chart type and library
...
Task List
Documentations
New graphs and transformations using pivot (+ test)
Same type of rendering for all graphs (here highchart has a download button for example)
Task List
Results
...
- Readme for steps to add a new chart
- Readme on steps to add a new library
...
Fixes
- Bower dependencies versions need to be persisted in bower.json
- Consistency between rendered graphs: titles, axis, buttons, etc
- Removed debug logs
- Footer position is to be absolute
...
Deployment
- In every milestone, deploy to repository `gh-pages`
...
Test Cases:
- Update naming pattern for test cases
- Remove repeating test
- Better separation / mapping for src to test
- Few Test Use cases
...
Results
- Adding New Chart Type (Read Me)
- eg: Adding new chart type Pie Chart

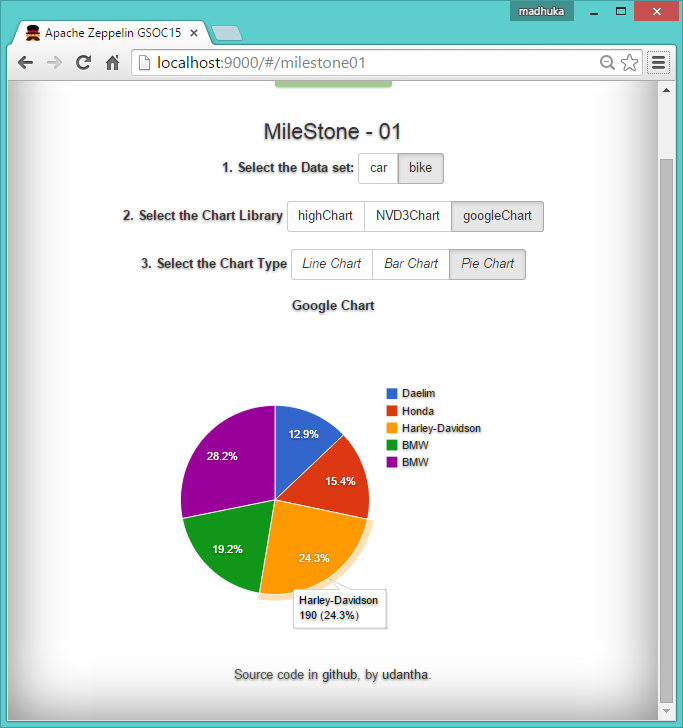
- eg: Adding new chart type Pie Chart
- Adding New Chart Library (Read Me)
- Test Coverage (50 Test covered Factories/ Services/ Controllers/ User cases )
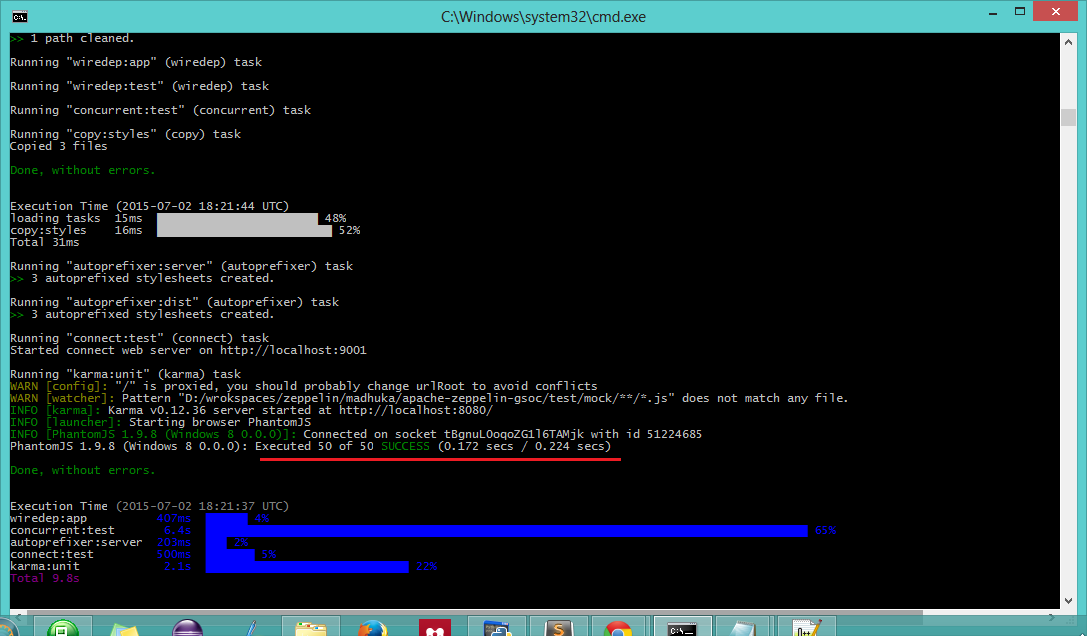
Site :
...
| Anchor | ||||
|---|---|---|---|---|
|
Milestone-5
Description
In this milestone, we will start working on Zeppelin Code Base. It will also help you being more familiar with the source code of the project.
Feature List
- Adding suitable geographic information system (GIS Mapping visualization) library that respects the license of Apache Zeppelin
- Setup Testing system for Zeppelin
Resources
|
|---|
Task List
- Research existing Map Visualizations, and propose a suitable one that respects the license limitations of Apache Zeppelin
- Make a JIRA issue and start a conversation in the mailing list
- Implement the new visualization as much as possible outside of the paragaph.js file (new file)
- Add the testing system to our Grunt process
- Make tests for the new Map visualization
- Make 2-3 scenario tests for Zeppelin
...
Results
'grunt test' is working after the fix
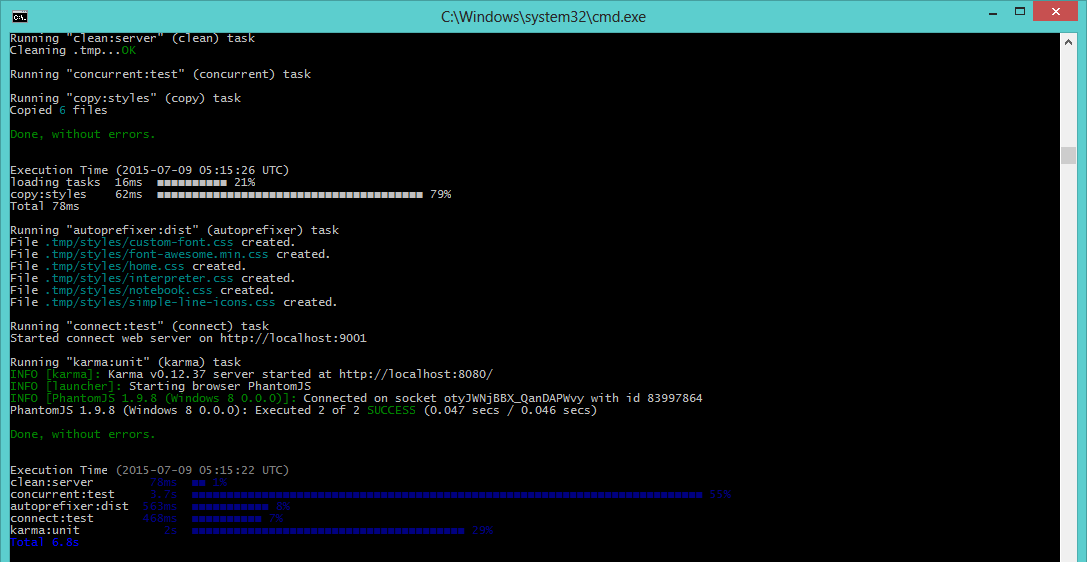
Decisions can be found in email thread subjected "[GSOC] Map Visualization for Zeppelin" in dev@zeppelin.incubator.apache.org
Libraries was on the list for decision
- Google Map Chart
- Geochart
- Highmaps
- OpenLayers
- Leaflet
JIRA on Map Visualizations
| Jira | ||||||
|---|---|---|---|---|---|---|
|
| Anchor | ||||
|---|---|---|---|---|
|
Milestone-6
Description
In this milestone, we will work on Zeppelin Code Base. Adding leafletJS library for (World Map) Mapping visualization and sample tutorial
Feature List
- Adding Leaflet of Apache Zeppelin
- Add 'Data Validator' for the Map graph input format
- Improving test for CI integration
Resources
|
|---|
Task List
Adding `./grunt buildSkipTest` and `./grunt buildWithTest`
Create an Issue on zeppelin for CI integration
Finding GIS sample data set and read it (Build a tutorial, which can be run from the clean environment)
Adding Leaflet for Mapping library
Define 'default schema' for the Map graph input format - structure
Add 'validator' for the Map graph input format
- Schema validator expose as services
Integrating query result + pivot system in map (maybe even custom pivot value)
Making tests
...
Results
Tutorial script will download the sample data set and draw the map.

Sample tutorial in clean pack.

Sample Data set in table view.
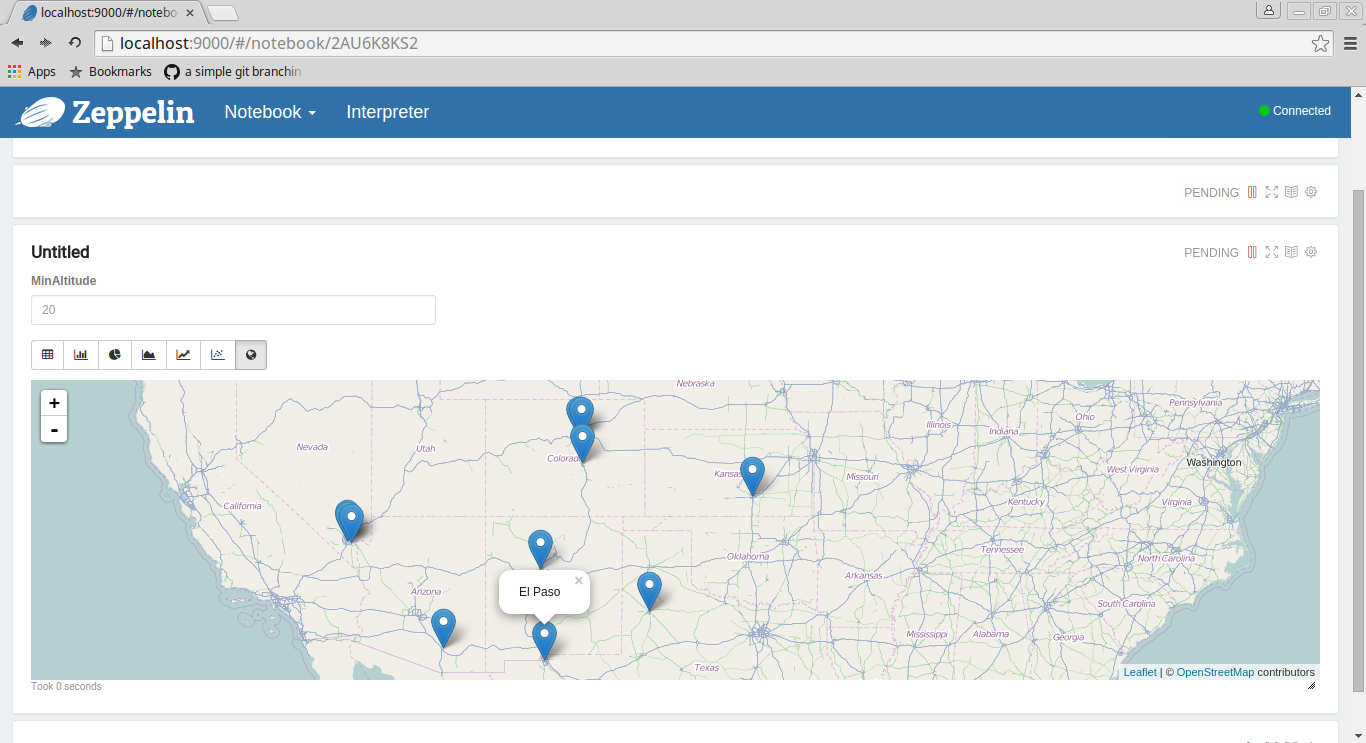
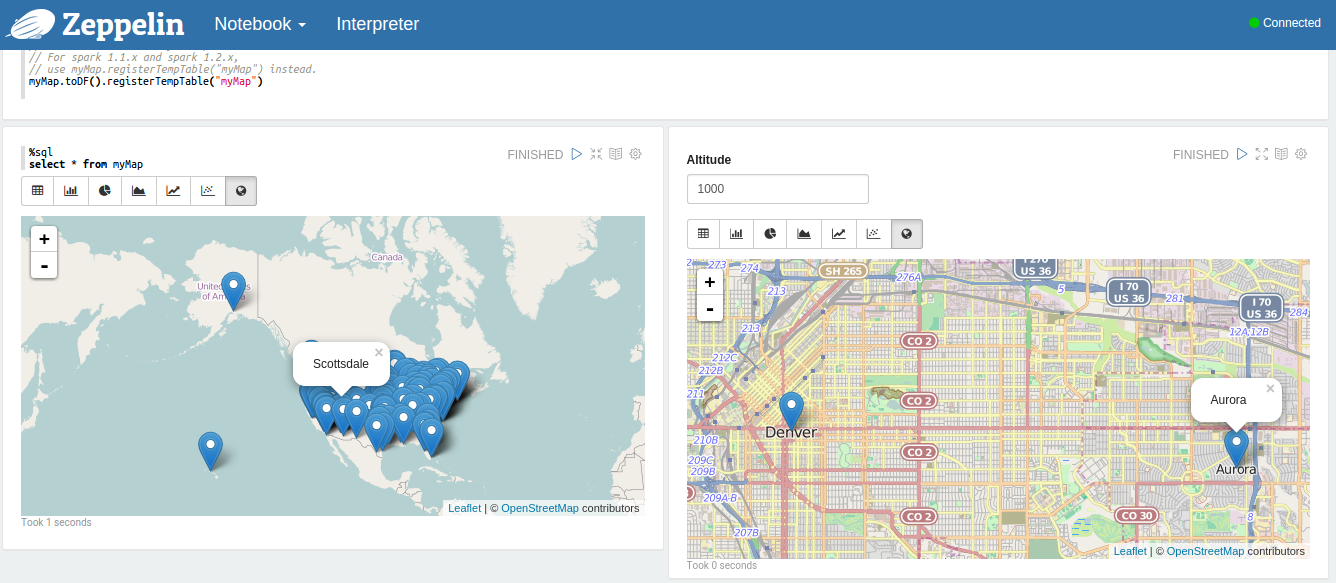
Makers on Map after results querying
Data validation is exposed as services. (you can set schema for data model and called with the services)
| Anchor | ||||
|---|---|---|---|---|
|
Milestone-7
Description
In this milestone, we will work on Zeppelin Code Base. Improve Data Validation factory for generalize mode and where it can be extendable.
Feature List
- Build Data validation method for other charts in zeppelin (Basic Validation)
- eg: Bar chart, Line chart, Bubble chart.. etc. (string and number validation)
- Adding Type validation for Map and charts in zeppelin.
- Adding Map Data Validated for latitude and longitude (data range validation)
Resources
|
|---|
Task List
- Data Validation factory for generalize mode
- Adding Basic type validation feature for `DataValidator` factory
- Exposing data validation as services in `DataValidatorService`
- Schema are configured in data-validator-schema.js
...
- Adding Type validation for Map and charts in zeppelin.
- chart-data-validator-factory for validate d3 basic chart data model
- map-data-validator-factory for map data model
- scatter-data-validator-factory for scatter and bubble chart data model
- Adding Map Data Validated for latitude and longitude (data range validation)Paragraph controller will using data validation before chart drawing (since error services is not in zeppelin it is using console.log at the moment)
longitudeValidator : .Longitude measurements range from 0° to (+/–)180°
latitudeValidator : Latitude measurements range from 0° to (+/–)90°.
...
Results
Drawing map with data validation
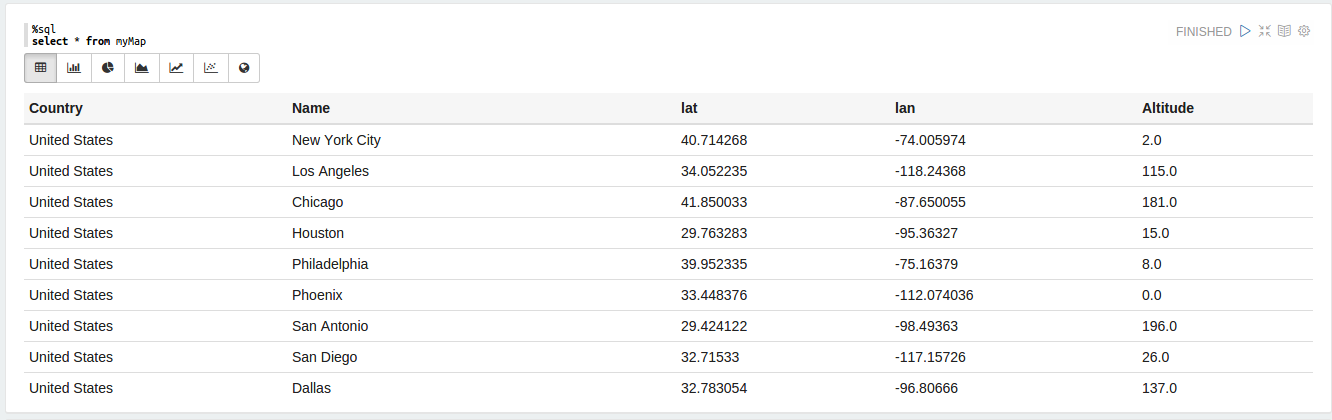
Above is the data set, Data validation will check is Longitude and Latitude is in valid range. Here Map with above data sert
| Anchor | ||||
|---|---|---|---|---|
|
Milestone-8
Description
In this milestone, we will work on Zeppelin Documentation, Code Polishing and Test Spec
Feature List
- Documentation
- Writing a new documentation in gh-pages[2]
- How to add new chart library (steps that contains for adding new chart JS)
- How added new data validator
Code Polishing
- Adding Test spec regard to Map implementations
- Fixing Grunt Test in zeppelin and upgrading it to build
Resources
|
|---|
Task List
- Documentation for Zeppelin
- Writing a new documentation in gh-pages[2]
- How to add new chart library with sample codes
- How added new data validator with sample codes
- Code Polishing
- Using data validation for all the chart types in zeppelin
- Bar, Pie, Area and Line chart
- Scatter and Bubble chart
- Map (GIS) date set
- Code reviewing on PR#152, PR#160, PR#147 and PR#179
- Adding Test spec regard to Map implementations
- Fixing Grunt Test in zeppelin and upgrading it to build
- Adding Few Custom Validator samples
- Adding Range validator for map-data-validator-factory.js
- Complex JS object validator for chart-data-validator-factory.js
...
Results
Here is sample schema for Map data model
| Wiki Markup |
|---|
    'MapSchema': {
      type: ['string', 'string', 'number', 'number', 'number'],
      range: {
        latitude: {
          low: -90,
          high: 90
        },
        longitude: {
          low: -180,
          high: 180
        }
      }
} |
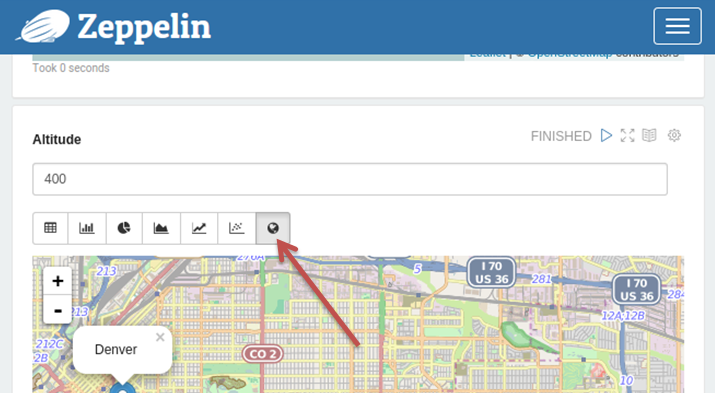
Updating Map feature for zeppelin with data validator
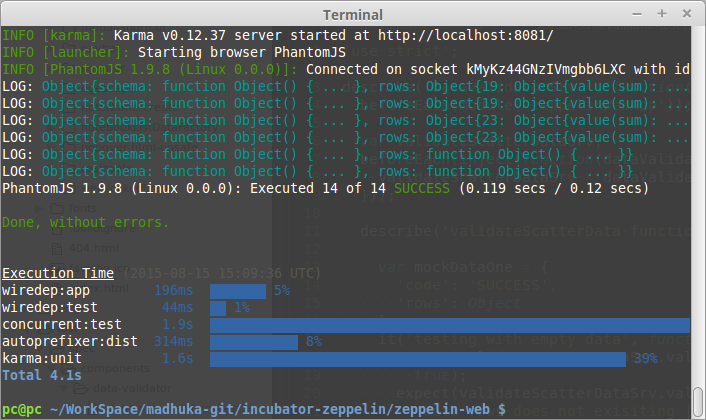
Test Spec for build and grunt test improvement
New 12 Test Specs are added with covering data validation user cases.
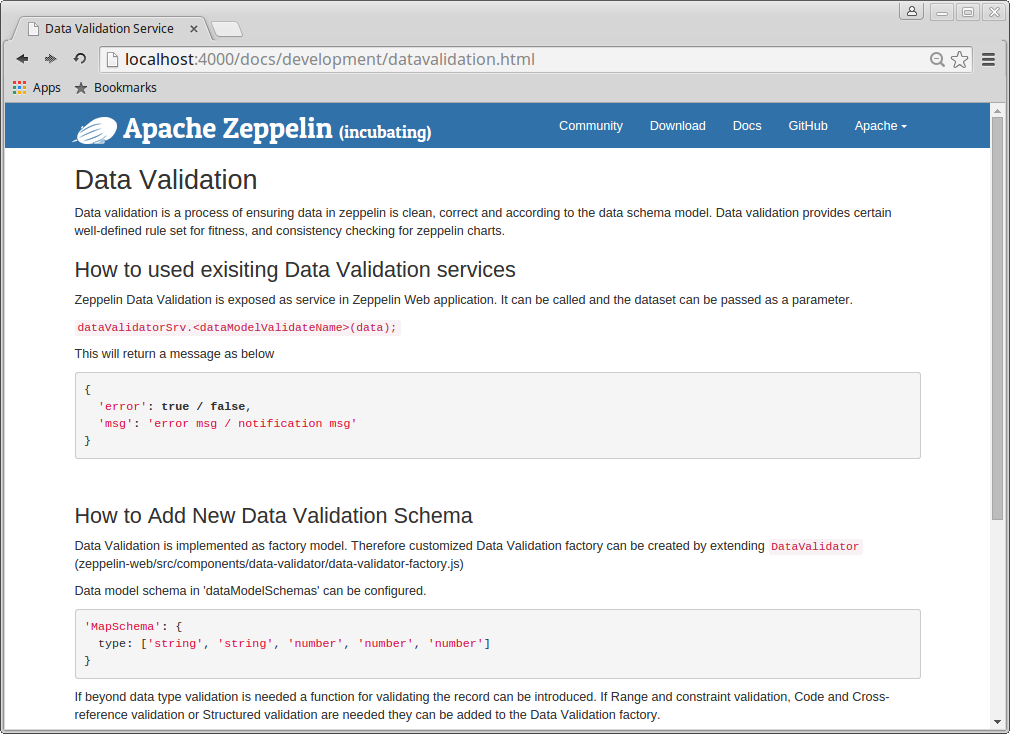
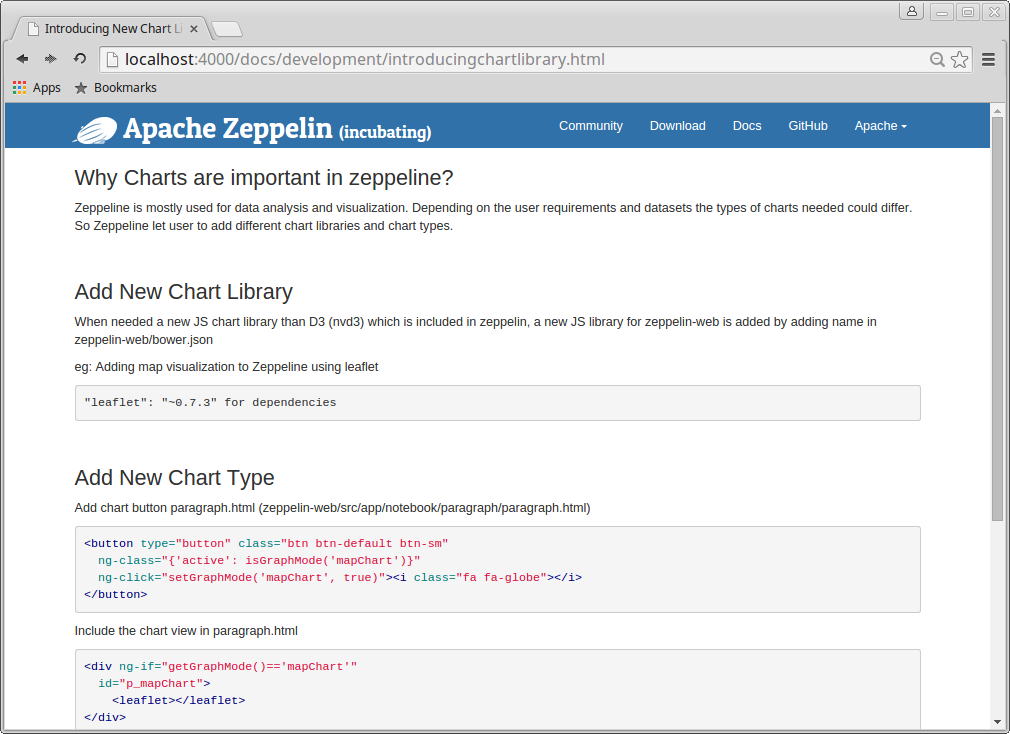
Documentation updating
| Anchor | ||||
|---|---|---|---|---|
|
Milestone-9
Description
In this milestone, we have completed all the work on Zeppelin (Coding, Documentation and Test Case). It mainly improve documentation
Feature List
- Improve Documentation
- With sample codes
Resources
|
|---|
Task List
Improving Documentation
- Data Validation Document is Updated with below sub titles.
- Where, Why the data validator is used in zeppelin?
- Why the data validator is important?
- How Data Validation is done?
- Adding new Data Range Validation Sample for Doc
- Cleaning the code (logs etc.)
...
Milestone-5
Description
This is a temporary roadmap for milestone-5, the features might change in the future
This should be the milestone where we start a PR inside of Zeppelin repository
Ressources
|
|---|
Feature List
Bring new feature to the chart system (download data, make pdf from graph)
New features to pivot: ordering, limits
Task List
...