THIS IS A TEST INSTANCE. ALL YOUR CHANGES WILL BE LOST!!!!
...
- (1) Smallest spread: 2.5 - (2.5) or ~0, resulting in approximately ~0% increase in latency
- (2) Largest spread: (3.5) - 1.5 or ~2, resulting in approximately 2/2 or ~100% increase in latency
This means we cannot effectively compare these two benchmark results as the latency in #2 is anywhere from 0 to 100% higher than in #1, which is a big spread and results in very different implications.
Public Interfaces
Briefly list any new interfaces that will be introduced as part of this proposal or any existing interfaces that will be removed or changed. The purpose of this section is to concisely call out the public contract that will come along with this feature.
A public interface is any change to the following:
Binary log format
The network protocol and api behavior
Any class in the public packages under clientsConfiguration, especially client configuration
org/apache/kafka/common/serialization
org/apache/kafka/common
org/apache/kafka/common/errors
org/apache/kafka/clients/producer
org/apache/kafka/clients/consumer (eventually, once stable)
Monitoring
Command line tools and arguments
- Anything else that will likely break existing users in some way when they upgrade
Proposed Changes
To achieve a higher precision to handle low-latency environments better, we can use Java’s System.nanoTime().
Proposed Changes
This KIP proposes using nanoTime() to record latencies to provide higher precision.
Latency will be recorded in microseconds by truncating the result of calling nanoTime() by 3 digits.
| Code Block | ||
|---|---|---|
| ||
long startTimeUs = System.nanoTime() / 1000;     // value in microseconds
// Send message…
// Message sent and callback called…
long latency = System.nanoTime() / 1000 - startTimeUs; // value in microseconds |
The code change required in this KIP is rather small, but this small change has a few considerations to discuss and address.
Considerations
Consideration #1: How Much Precision?
The first question to answer is how much precision do we need?
Since ProducerPerformance currently uses millisecond precision, we will determine the spread using values close to 1.0.
The examples below use two numbers that differ by only 1 in the least significant digit (last/right digit). Bracket denotes inclusive, and parenthesis denotes exclusive.
NOTE: When calculating the spread using numbers with a larger difference, you will observe a higher minimum spread (will not be zero).
Using scale = 1 (1 decimal place)
If we record a latency of 1.1 ms for the first run, and 1.2 ms in the second run, then the true values are:
- 1.1 = [1.05, 1.15)
- 1.2 = [1.15, 1.25)
Min spread: 1.15 - (1.15) = ~0
Max spread: (1.25) - 1.05 = ~0.2
Conclusion: Benchmark 2 is 0 to 20% slower than benchmark 1.
Using scale = 2 (2 decimal places)
If we record a latency of 1.01 ms for the first run, and 1.02 ms in the second run, then the true values are:
- 1.01 = [1.005, 1.015)
- 1.02 = [1.015, 1.025)
Min spread: 1.015 - (1.015) = ~0
Max spread: (1.025) - 1.005 = ~0.02
Conclusion: Benchmark 2 is 0 to 2% slower than benchmark 1.
Using scale = 3 (3 decimal places)
If we record a latency of 1.001 ms for the first run, and 1.002 ms in the second run, then the true values are:
- 1.001 = [1.0005, 1.0015)
- 1.002 = [1.0015, 1.0025)
Min spread: 1.0015 - (1.0015) = ~0
Max spread: (1.0025) - 1.0005 = ~0.0020
Conclusion: Benchmark 2 is 0 to 0.2% slower than benchmark 1.
By using 3 decimal places in millisecond latency measurements, we are able to observe a ~0.2% spread in a low-latency environment dealing with latencies around 1 ms. 3 decimal places for milliseconds is equivalent to microseconds. This 0.2% spread is quite small, especially since other factors are likely to generate a larger variance.
Consideration #2: Long Overflow
It is important to look at potential overflow as we are saving latency in microseconds now, which means each value is multiplied by 1000 (1 millisecond is 1000 microseconds).
To calculate overall average latency, ProducerPerformance will save all observed latencies in a single `totalLatency` long variable.
We can run some calculations to observe how many record latencies can be stored in a Long based on different average latencies.
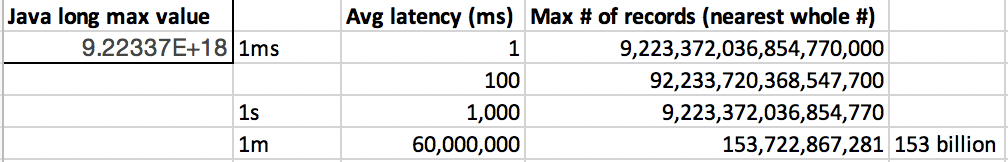
The chart above shows that if the average latency is 1 minute, then a Long can hold 153 billion records (latencies). This covers most use cases.
Public Interfaces
This proposed change only impacts the output of the ProducerPerformance.java class by adding more precisionDescribe the new thing you want to do in appropriate detail. This may be fairly extensive and have large subsections of its own. Or it may be a few sentences. Use judgement based on the scope of the change.
Compatibility, Deprecation, and Migration Plan
- What impact (if any) will there be on existing users?
- If we are changing behavior how will we phase out the older behavior?
- If we need special migration tools, describe them here.
- When will we remove the existing behavior?
Rejected Alternatives
This proposed change only impacts the output of the ProducerPerformance.java class by adding more precision.
Rejected Alternatives
1. Adding a "low-latency" option to enable recording measurements using System.nanoTime()If there are alternative ways of accomplishing the same thing, what were they? The purpose of this section is to motivate why the design is the way it is and not some other way.