THIS IS A TEST INSTANCE. ALL YOUR CHANGES WILL BE LOST!!!!
Disclaimer: These API are used internally by Ambari only. Ambari Metrics Service released with Ambari 2.0 and 2.1 does not support https or authentication for these internal metrics API.
Data structures
Source location for common data structures module: https://github.com/apache/ambari/tree/trunk/ambari-metrics/ambari-metrics-common/
POST
Sending metrics to Ambari Metrics Service can be achieved through the following API call.
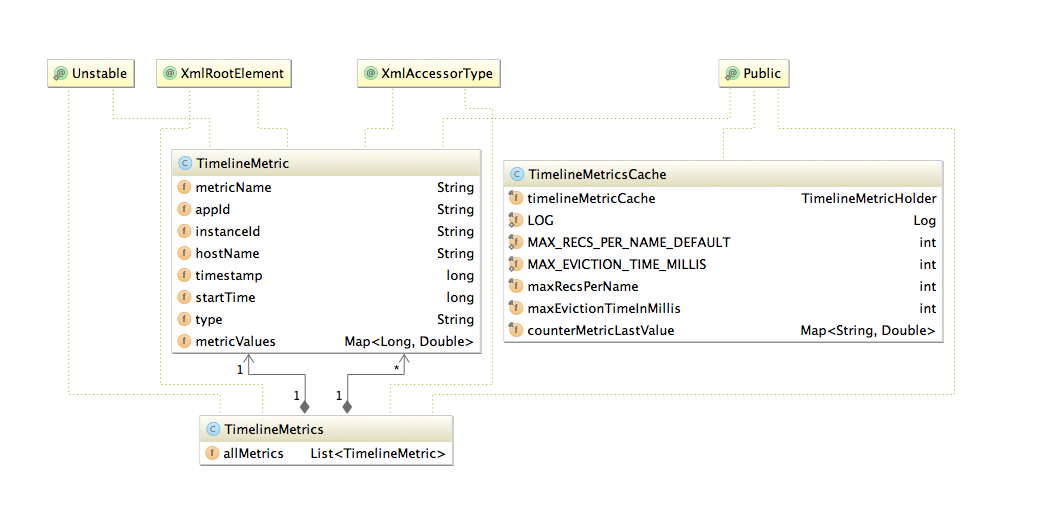
The Sink implementations responsible for sending metrics to AMS, buffer data for 1 minute before sending. TimelineMetricCache provides a simple cache implementation to achieve this behavior.
Sample sink implementation use by Hadoop daemons: https://github.com/apache/ambari/tree/trunk/ambari-metrics/ambari-metrics-hadoop-sink
POST http://<ambari-metrics-collector>:6188/ws/v1/timeline/metrics
{
  "metrics": [
    {
      "metricname": "AMBARI_METRICS.SmokeTest.FakeMetric",
      "appid": "amssmoketestfake",
      "hostname": "ambari20-5.c.pramod-thangali.internal",
      "timestamp": 1432075898000,
      "starttime": 1432075898000,
      "metrics": {
        "1432075898000": 0.963781711428,
        "1432075899000": 1432075898000
      }
    }
  ]
}
|
Connecting (POST) to <ambari-metrics-collector>:6188/ws/v1/timeline/metrics/
Http response: 200 OK
GET
GET http://<ambari-metrics-collector>:6188/ws/v1/timeline/metrics?metricNames=AMBARI_METRICS.SmokeTest.FakeMetric&appId=amssmoketestfake&hostname=<hostname>&precision=seconds&startTime=1432075838000&endTime=1432075959000
Http response: 200 OK
Http data:
{"metrics": [ {"timestamp": 1432075898089, "metricname": "AMBARI_METRICS.SmokeTest.FakeMetric", "appid": "amssmoketestfake", "hostname": "ambari20-5.c.pramod-thangali.internal", "starttime": 1432075898000, "metrics": {"1432075898000": 0.963781711428, "1432075899000": 1432075898000 } } ] } |
The Metric Record Key data structure is described below:
Property | Type | Comment | Optional |
|---|---|---|---|
Metric Name | String | First key part, important consideration while querying from HFile storage | N |
Hostname | String | Second key part | N |
Server time | Long | Timestamp on server when first metric write request was received | N |
Application Id | String | Uniquely identify service | N |
Instance Id | String | Second key part to identify instance/ component | Y |
Start time | Long | Start of the timeseries data |
Precision query parameter
&precision=[ seconds, minutes, hours, days ]
- This flag can override which table gets queried and hence influence the amount of data returned.
All API calls honor a query limit set in the Collector service configs.
Query Time range | Resolution of returned metrics | Comments |
|---|---|---|
Last 1 hour | 30-60 sec resolution | Precision data available on demand as well |
Last 10 hours | 30-60 sec resolution | Honor query result limit |
Last 24 hours | 1 min aggregates | min and seconds precision available if requested |
Last week | 1 hour aggregates | |
| Last month | 1 hour aggregates | |
Last year | Daily aggregates | If query limit is reached query weekly aggregates |
Aggregation
- The granularity of aggregate data can be controlled by setting wake up interval for each of the aggregator threads.
- Presently we support 2 types of aggregators, HOST and APPLICATION with 3 time dimensions, per minute, per hour and per day.
- The HOST aggregates are just aggregates on precision data across the supported time dimensions.
- The APP aggregates are across appId. Note: We ignore instanceId for APP level aggregates. Same time dimensions apply for APP level aggregates.
- We also support HOST level metrics for APP, meaning you can expect a system metric example: "cpu_user" to be aggregated across datanodes, effectively calculating system metric for hosted apps.
- Each aggregator performs checkpointing by storing last successful time of completion in a file. If the checkpoint is too old, the aggregators will discard checkpoint and aggregate data for the configured interval, meaning data in between (now - interval) time.
- Refer to Phoenix table schema for details of tables and records.